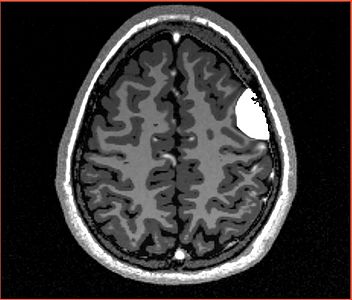
Meningioma growth modeling with TumorSim
This is a follow-up project for Meningioma growth simulation project within 2009 Boston programming week project.
tumorsim1.1rc2 experiments
NOTE: red outlines the boundary of the label corresponding to the initial tumor seed!
| Seed 1 (default seed from Marcel)
<flash>file=Seed_1_simulation.swf|width=500|height=400|quality=best</flash> |
Seed 3 (ventricle)
<flash>file=Seed_3_simulation.swf|width=500|height=400|quality=best</flash> |
tumorsim1.1.rc4 experiments
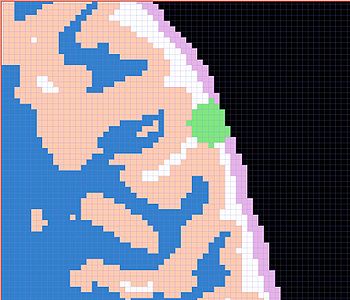
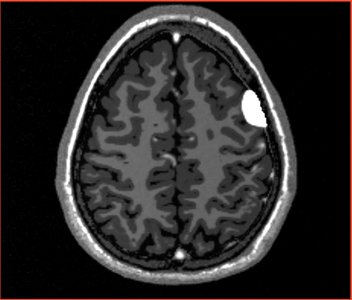
| All the following experiments are based on the "thin dura" input labels, and the tumor seed image shown on the right. The tumor label is shown in green color. Note that the tumor is touching the gray matter label.
The seed image can be downloaded File:Seed3.nrrd |
Also, all of the experiments use the following configuration file, where POISSON value is substituted with 0.5, 0.4, and 0.2, with the simulation results shown below.
<?xml version="1.0"?>
<tumor-simulation-parameters>

<dataset-name>SimMeningioma001</dataset-name>

<input-directory>../TumorSimInputWithThinDura</input-directory>
<output-directory>./0.05</output-directory>

<brain-young-modulus>694</brain-young-modulus>
<brain-poisson-ratio>POISSON</brain-poisson-ratio>

<deformation-seed>../SlicerScenes/NewSeed3-1.nrrd</deformation-seed>
<deformation-iterations>10</deformation-iterations>
<deformation-initial-pressure>3.0</deformation-initial-pressure>
<deformation-kappa>1e+06</deformation-kappa>
<deformation-damping>1</deformation-damping>

<deformation-solver-iterations>8</deformation-solver-iterations>
<infiltration-solver-iterations>2</infiltration-solver-iterations>

<infiltration-iterations>2</infiltration-iterations>
<infiltration-time-step>1e-6</infiltration-time-step>
<infiltration-early-time>0.5e-6</infiltration-early-time>
<infiltration-body-force-iterations>2</infiltration-body-force-iterations>
<infiltration-body-force-coefficient>10.0</infiltration-body-force-coefficient>

<contrast-enhancement-type>uniform</contrast-enhancement-type>

<number-of-threads>16</number-of-threads>
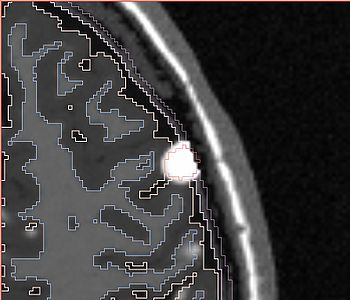
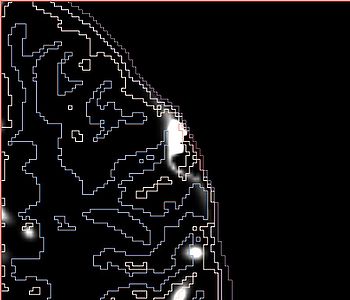
The following screenshots capture the same axial slice (#119) of the following images in order: (1) image containing the tumor probabilities, and (2) the simulated Gad enhanced image, both overlayed with the warped tumor/brain tissues labels.
| Poisson ratio 0.5
(initial value) |
Note very very minimal deformation of the surrounding brain tissue, although the tumor volume increased, for Poisson=0.5. |
| Poisson ratio 0.4 |
| Poisson ratio 0.2 |
Standing questions/items
- limited tumor growth/surrounding brain deformation with 10 iterations -- try more iterations?
- reduction of Poisson ratio makes results very unrealistic
- rerun the previous version of tumorsim, which seemed to show nice more realistic deformation of the brain tissue (with Poisson=0.5)
