Difference between revisions of "Slicer3:TimeSeries and Multi-Volume Data"
| Line 30: | Line 30: | ||
* alignment through registration or adjusting TS1 versus TS2 (or 3) by dragging one of them left or right | * alignment through registration or adjusting TS1 versus TS2 (or 3) by dragging one of them left or right | ||
| − | [[image:Ron-TimeSeriesMockup.png]] | + | [[image:Ron-TimeSeriesMockup.png|thumb|300px]] |
=== Existing GUI Resources === | === Existing GUI Resources === | ||
Revision as of 13:28, 1 February 2008
Home < Slicer3:TimeSeries and Multi-Volume DataContents
Slicer3 support for TimeSeries and Multi-Volume Data
Feature ideas
Just a collection of ideas related to time series data in no particular order.
- Would like to dynamically load data in a background thread to minimize memory requirements
- Need to understand how this will impact performance, i.e. can we page through the slices in real time?
- Flexible processing
- Volume by volume
- Slice by Slice (would require a "block of bytes" format like NRRD, Analyze, or NIFTI)
Potentially useful codes
Proposed Data Model
Use Cases
Mock-ups and ideas
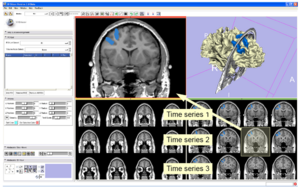
Ron's mock-up for time series layout using the light box capability in Slicer 3:
- Layout: green and yellow are a single box. Red shows a single zoomed in image, selected by clicking
- alignment through registration or adjusting TS1 versus TS2 (or 3) by dragging one of them left or right
Existing GUI Resources
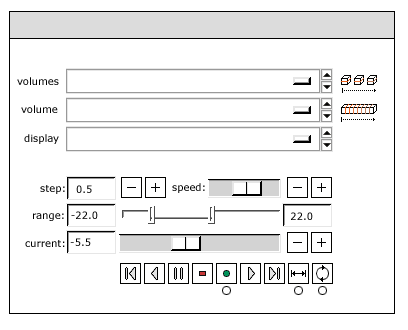
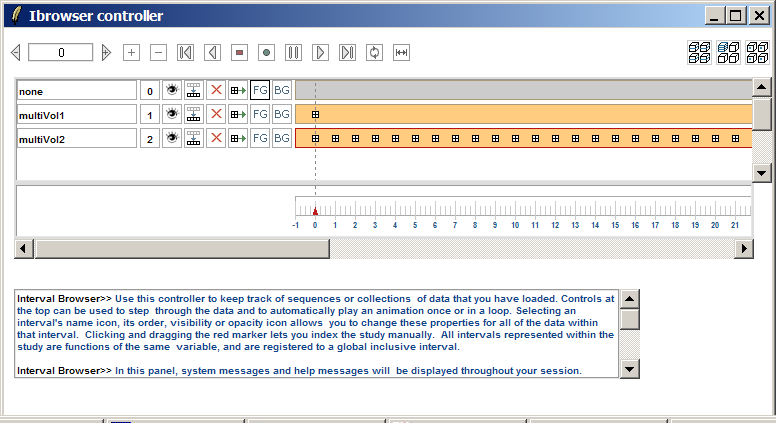
Below are interface elements for which GUI resources already exist. The Basic Controller and Cine Controller are not attached to any logic or data structures. The Interval Browser is part of Slicer2.6.
Hierarchical Management of Large Data Sets
From an earlier discussion:
Here are some notes for our discussion about a project to address the need to browse through large volumetric datasets interactively. The particular issue that I think needs to be addressed is matching the data passing through the display pipeline to the actual resolution of the display windows or texture maps.
For example, if you have a 8k x 8k x 8k volume data set, and you want to view it in a 1k by 1k window with arbitrary slice planes, the current classes in VTK and ITK would require loading the full 512 Gigapixels of data into memory and then pulling out the 1k by 1k slice plane, which on almost any computer would require a lot of virtual memory paging, if its possible at all. Assuming your reslice plane is different then the way the volume is laid out in memory, there will be a high level of cache misses and memory thrashing. A similar issue occurs when zooming in to a small section within a large volume -- in order to extract the volume of interest, the full volume must be read into memory.
A better way to approach this problem is to preprocess the volume data so that a hierarchy of different resolutions are available (full size, 1/2 size, 1/4 size, etc) and the volume data can be decomposed into blocks so that only the necessary parts are read in order to display the currently selected view. There is a large literature on these types of techniques. Google Maps/Earth are good example of this technique applied to a large database with good interactive feel.
I'd like to see a project to implement this approach inside VTK (and, possibly, ITK). There have been a few attempts in the past (DataCutter at OSU, is similar, I believe, but the code doesn't appear to be available and so far the people I've been asking at BWH, GE, Kitware don't know the details -- this is something I can research more).
What I have in mind is four related tools: (1) a preprocessor to build a hierarchical volume datastructure/database, (2) a server that will take requests for a given extent at a given resolution and provide back the volume data, (3) a demo web site that will allow interactive browsing through large data sets, and (4) an implementation in slicer to load and display these multi-resolution volumes for interactive visualization.


