Difference between revisions of "2009 Winter Project Week MRSI"
(New page: {| |thumb|320px|Return to [[2009_Winter_Project_Week|Project Week Main Page ]] |[[Image:Mrsi slicer.jpg|thumb|190px|Color-coded MRSI in the localization and grading...) |
|||
| (3 intermediate revisions by one other user not shown) | |||
| Line 2: | Line 2: | ||
|[[Image:NAMIC-SLC.jpg|thumb|320px|Return to [[2009_Winter_Project_Week|Project Week Main Page]] ]] | |[[Image:NAMIC-SLC.jpg|thumb|320px|Return to [[2009_Winter_Project_Week|Project Week Main Page]] ]] | ||
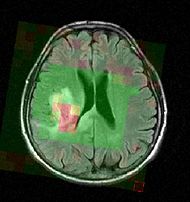
|[[Image:Mrsi slicer.jpg|thumb|190px|Color-coded MRSI in the localization and grading of brain tumors.]] | |[[Image:Mrsi slicer.jpg|thumb|190px|Color-coded MRSI in the localization and grading of brain tumors.]] | ||
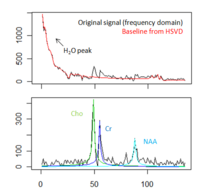
| + | |[[Image:Spectral fitting mrs.png|thumb|220px|Fitting metabolite models to the MRS signal of tumorous brain tissue. Top: Original FID signal and estimated baseline. Bottom: Estimated resonance lines for three relevant metabolites.]] | ||
|} | |} | ||
| − | |||
__NOTOC__ | __NOTOC__ | ||
| + | ===Key Investigators=== | ||
| + | * BWH SPL / MIT CSAIL: Bjoern Menze | ||
| − | |||
| − | |||
| − | |||
<div style="margin: 20px;"> | <div style="margin: 20px;"> | ||
<div style="width: 40%; float: left; padding-right: 3%;"> | <div style="width: 40%; float: left; padding-right: 3%;"> | ||
<h1>Objective</h1> | <h1>Objective</h1> | ||
| − | Magnetic resonance spectroscopic imaging (MRSI) is a non-invasive diagnostic method used to determine the relative abundance of specific metabolites at arbitrary locations in vivo. Certain diseases - such as tumors in brain, breast and prostate - can be can be associated with characteristic changes in the metabolic level. Thus, proton MRSI is in principle very well suited for the detection, localization and grading of these diseases. A major challenge in MRSI, however, lies in the | + | Magnetic resonance spectroscopic imaging (MRSI) is a non-invasive diagnostic method used to determine the relative abundance of specific metabolites at arbitrary locations in vivo. Certain diseases - such as tumors in brain, breast and prostate - can be can be associated with characteristic changes in the metabolic level. Thus, proton MRSI is in principle very well suited for the detection, localization and grading of these diseases. A major challenge in MRSI, however, lies in the post-processing and evaluation of the acquired spectral volumes. |
| − | The objective of the current project is to develop a module proving the means for the processing and visualization of MRSI | + | The objective of the current project is to develop a module proving the means for the processing and visualization of MRSI -- and thus for a joint analysis of magnetic resonance spectroscopic images together with other imaging modalities -- in Slicer. |
</div> | </div> | ||
<div style="width: 27%; float: left; padding-right: 3%;"> | <div style="width: 27%; float: left; padding-right: 3%;"> | ||
<h1>Approach, Plan</h1> | <h1>Approach, Plan</h1> | ||
| − | + | Spectral fitting routines have been implemented, using a HSVD filter for water peak removal and baseline estimation, and a constrained non-linear least squares optimization for the fit of the resonance line models. | |
| + | |||
| + | The plan for the project week is to integrate these routines - for data in/out, global registration, and visualization of the metabolite maps - into Slicer using the Slicer-Python interface. | ||
</div> | </div> | ||
| − | <div style="width: | + | <div style="width: 22%; float: left; padding-right: 3%;"> |
<h1>Progress</h1> | <h1>Progress</h1> | ||
| − | + | Designed a basic visualization/interaction of spectra and fitting result using the Python interface. | |
| − | |||
</div> | </div> | ||
| − | |||
</div> | </div> | ||
Latest revision as of 20:58, 2 February 2009
Home < 2009 Winter Project Week MRSI Return to Project Week Main Page |
Key Investigators
- BWH SPL / MIT CSAIL: Bjoern Menze
Objective
Magnetic resonance spectroscopic imaging (MRSI) is a non-invasive diagnostic method used to determine the relative abundance of specific metabolites at arbitrary locations in vivo. Certain diseases - such as tumors in brain, breast and prostate - can be can be associated with characteristic changes in the metabolic level. Thus, proton MRSI is in principle very well suited for the detection, localization and grading of these diseases. A major challenge in MRSI, however, lies in the post-processing and evaluation of the acquired spectral volumes.
The objective of the current project is to develop a module proving the means for the processing and visualization of MRSI -- and thus for a joint analysis of magnetic resonance spectroscopic images together with other imaging modalities -- in Slicer.
Approach, Plan
Spectral fitting routines have been implemented, using a HSVD filter for water peak removal and baseline estimation, and a constrained non-linear least squares optimization for the fit of the resonance line models.
The plan for the project week is to integrate these routines - for data in/out, global registration, and visualization of the metabolite maps - into Slicer using the Slicer-Python interface.
Progress
Designed a basic visualization/interaction of spectra and fitting result using the Python interface.

