Difference between revisions of "RobustStatisticsSegmentation"
From NAMIC Wiki
| Line 79: | Line 79: | ||
BWH: Katie Hayes, Andriy Fedorov, and Ron Kikinis | BWH: Katie Hayes, Andriy Fedorov, and Ron Kikinis | ||
| + | |||
| + | == Publications == | ||
| + | |||
| + | The method is based on: | ||
| + | * [http://www.na-mic.org/publications/pages/display?search=StatisticalSegmentationSlicer2&submit=Search&words=all&title=checked&keywords=checked&authors=checked&abstract=checked&searchbytag=checked&sponsors=checked| NA-MIC Publications Database] | ||
| + | * Yang, Y. and Tannenbaum, A. and Giddens, D. and Coulter, WH, "Knowledge-based 3D segmentation and reconstruction of coronary arteries using CT images", in IEEE EMBS 2004, pp1664--1666 | ||
Revision as of 19:26, 19 November 2009
Home < RobustStatisticsSegmentationRobust Statistics Based Segmentation
Description
How to get the module
- start Slicer 3.5
- open View->Extension Manager
- check "Find & Install", click "Next"
- in the list, select "LocalRegionalSegModule", then "Download & Install", and "Next"
- Slicer will ask to restart, confirm.
- after restarts, the module is in Module category: "Segmentation-->Localized Region-based Segmentation"
Usage
- Note:
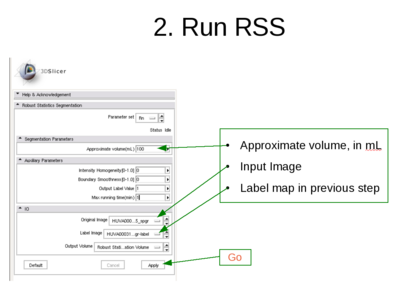
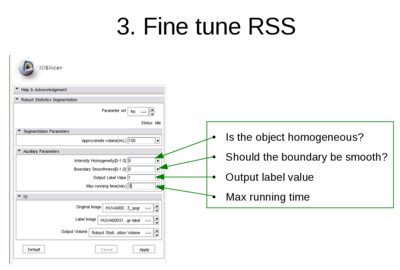
- The Approximate volume is just a rough upper limit for the volume. It should be at least the size of the object. This is because when the volume reaches that, the program must stop. However, other criteria may stop the algorithm before the volume reaches this value.
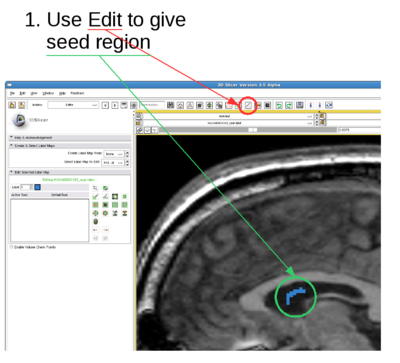
- The fiducial points can be thrown into the object. What I do is I just add two fiducial points and move them into the object within one slice.
Testing
Several tests are conducted and shown here along with the parameters used to get the results.
Testing case: left kidney
- Data set: http://wiki.na-mic.org/Wiki/images/8/8d/Patient1.tar.gz
- Approximate volume: 200 mL
- Boundary smoothness: 0.5
- Intensity homogeneity: 0.1
Testing case: tumor
- Data set: http://wiki.na-mic.org/Wiki/images/0/0f/MayExperiments.zip (DiffusionEditorBaselineNode.nrrd)
- Approximate volume: 30 mL
- Intensity homogeneity: 0.1
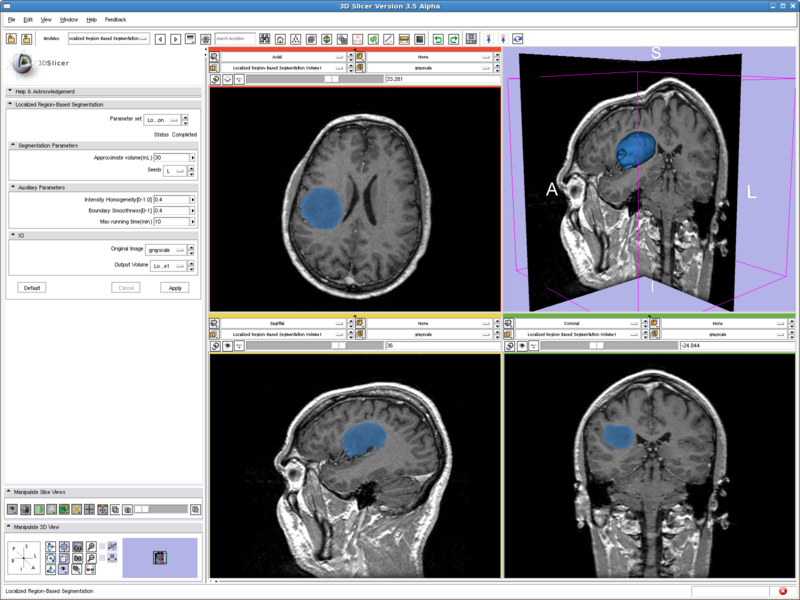
Testing case: tumor
- Data set: http://www.spl.harvard.edu/publications/bitstream/download/4217 (case3/grayscale.nrrd)
- Approximate volume: 30 mL
- Intensity homogeneity: 0.4
Testing case: tumor
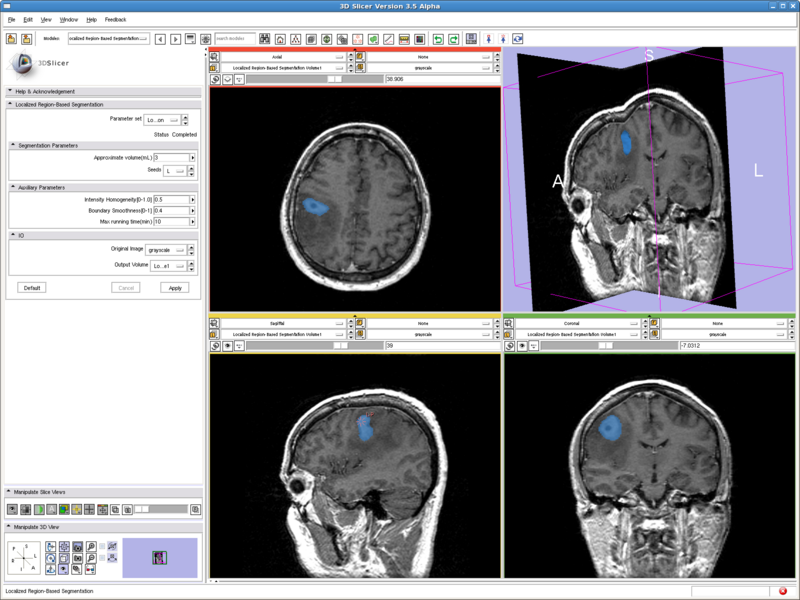
- Data set: http://www.spl.harvard.edu/publications/bitstream/download/4217 (case5/grayscale.nrrd)
- Approximate volume: 3 mL
- Intensity homogeneity: 0.5
- Boundary smoothness: 0.4
This is a difficult case. All the other methods tested either captures only the middle dark spot, or leaks out of the tumor. But the method here nicely capture both the dark core and the bright shell, without leaking out to regions with intensities in the middle.
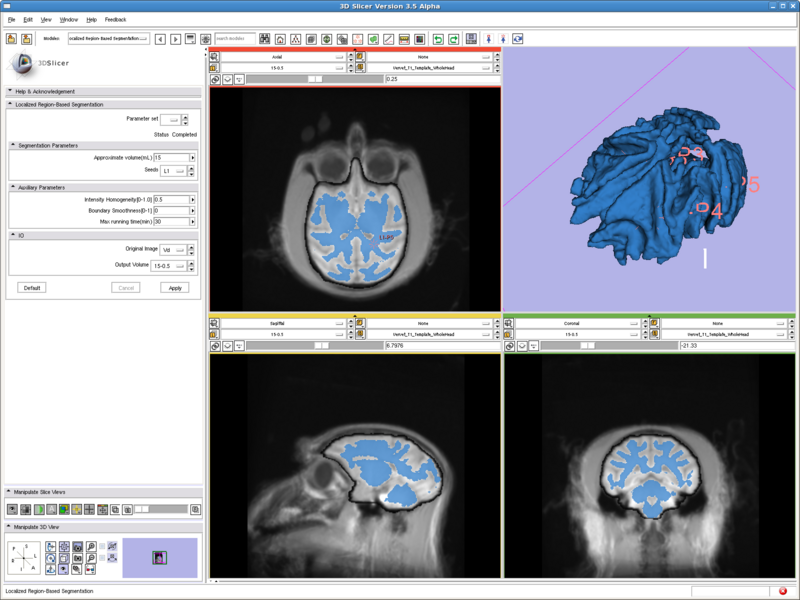
Testing case: vervet brain
- Data set: http://www.na-mic.org/Wiki/index.php/Vervet_MRI_registration (http://www.bsl.ece.vt.edu/data/vervet_atlas/VPA-10-1.1.zip Vervet_T1_Template_WholeHead.nii)
- Approximate volume: 15 mL
- Intensity homogeneity: 0.5
Previous tests all run with two fiducial points, and running time are all less than 10 seconds. This case has 6 points and runs for 15min to get the result shown.
Key Investigators
Georgia Tech: Yi Gao and Allen Tannenbaum
BWH: Katie Hayes, Andriy Fedorov, and Ron Kikinis
Publications
The method is based on:
- NA-MIC Publications Database
- Yang, Y. and Tannenbaum, A. and Giddens, D. and Coulter, WH, "Knowledge-based 3D segmentation and reconstruction of coronary arteries using CT images", in IEEE EMBS 2004, pp1664--1666
