Difference between revisions of "Projects:BayesianMRSegmentation"
| (40 intermediate revisions by 5 users not shown) | |||
| Line 1: | Line 1: | ||
| − | Back to [[NA-MIC_Internal_Collaborations: | + | Back to [[NA-MIC_Internal_Collaborations:StructuralImageAnalysis|NA-MIC Collaborations]], [[Algorithm:MIT|MIT Algorithms]] |
__NOTOC__ | __NOTOC__ | ||
| + | = Bayesian Segmentation of MRI Images = | ||
| − | = | + | = Description = |
| − | + | The aim of this project is to develop, implement, and validate a generic method for segmenting MRI images that automatically adapts to different acquisition sequences. Towards this end, we design parametric computational models of how MRI images are generated, and then use these models to obtain automated segmentations in a Bayesian framework. | |
| − | |||
| − | + | The model we have developed incorporates a ''prior'' distribution that makes predictions about where neuroanatomical labels typically occur throughout an image, and is based on a generalization of probabilistic atlases that uses a deformable, compact tetrahedral mesh representation. The model also includes a ''likelihood'' distribution that predicts how a label image, where each voxel is assigned a unique neuroanatomical label, translates into an MRI image, where each voxel has an intensity. | |
| − | + | Given an image to be segmented, we first estimate the parameters of the model that are most probable in light of the data. The parameter estimation involves finding the deformation that optimally warps the mesh-based probabilistic atlas onto the image under study, estimating MRI intensity inhomogeneities corrupting the image, as well as finding the mean intensity and the intensity variance for each of the structures to be segmented. Once these parameters are estimated, the most probable image segmentation is obtained. | |
| − | + | == Application to Hippocampal Subfield Segmentation == | |
| − | + | We have used our technique to automatically segment several subfields of the hippocampus directly from ultra-high resolution ''in vivo'' MRI data. Recent developments in MR data acquisition technology have started to yield images that show anatomical features of the hippocampal formation at an unprecedented level of detail, providing the basis for hippocampal subfield measurement. Because of the role of the hippocampus in human memory and its implication in a variety of disorders and conditions, the ability to reliably and efficiently quantify its subfields through in ''vivo'' neuroimaging is of great interest to both basic neuroscience and clinical research. | |
| − | We have validated | + | We have validated our technique by comparing our automated segmentation results with corresponding manual delineations in ultra-high resolution MRI scans (voxel size 0.38x0.38x0.80mm^3) of 10 individuals. For each of seven structures of interest (fimbria, CA1, CA2/3, CA4/DG, presubiculum, subiculum, and hippocampal fissure), we calculated the Dice overlap coefficient, defined as the volume of overlap between the automated and manual segmentation divided by their mean volume. We used a leave-one-out cross-validation strategy, in which we built an atlas mesh from the delineations in nine subjects, and used this to segment the image of the remaining subject. We repeated this process for each of the 10 subjects, and compared the automated segmentation results with the corresponding manual delineations. |
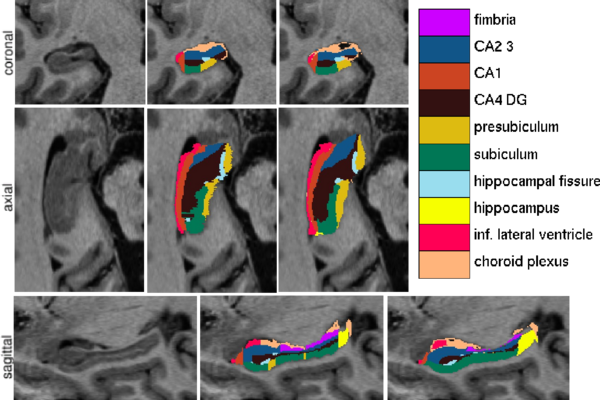
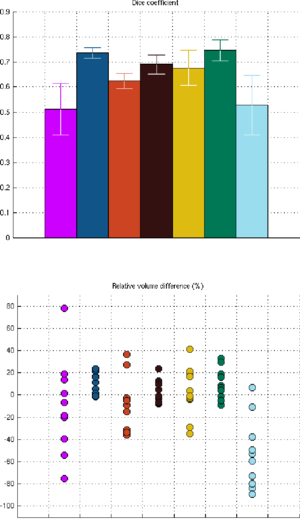
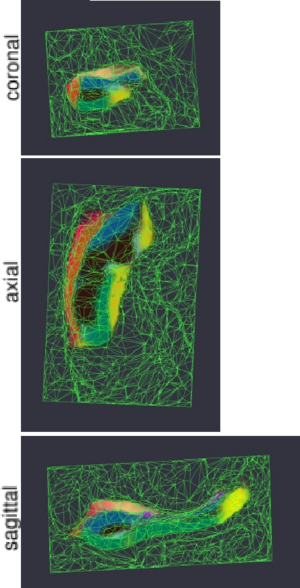
| − | Figure 1 compares the manual and automated segmentation results qualitatively on a set of cross-sectional slices | + | Figure 1 compares the manual and automated segmentation results qualitatively on a set of cross-sectional slices. The upper half of figure 2 shows the average Dice overlap measure for each of the structures of interest, along with error bars that indicate the standard errors around the mean. The lower half of the figure shows, for each structure, the volume differences between the automated and manual segmentations relative to their mean volumes. An example of our mesh-based probabilistic atlas, derived from nine manually labeled hippocampi, is shown in figure 3. |
| + | [[Image:MITHippocampalSubfieldSegmentationQualitative.png|thumb|center|600px|Fig 1. From left to right: ultra-high resolution MRI data, manual delineations, and corresponding automated segmentations.]] | ||
| + | |||
| + | <table align="center"> | ||
| + | <tr> | ||
| + | <td> | ||
| + | [[Image:MITHippocampalSubfieldSegmentationQuantitative.png|thumb|center|300px|Fig 2. Dice overlap measures (top) and relative volume differences (bottom) between automated and manual segmentations. The colors are as in figure 1.]] | ||
| + | </td> | ||
| + | <td> | ||
| + | [[Image:MITHippocampalSubfieldSegmentationAtlas.png|thumb|center|300px|Fig 3. Mesh-based probabilistic atlas, derived from manual delineations in nine subjects, warped onto the 10th subject shown in figure 1. The colors are as in figure 1.]] | ||
| + | </td> | ||
| + | </tr> | ||
| + | </table> | ||
| + | |||
| + | = Integration into Slicer = | ||
| + | |||
| + | We are currently working on integrating our method into 3D Slicer. Our aim is to provide an implementation that is fast and intuitive enough to be useful in hospital environments. | ||
= Key Investigators = | = Key Investigators = | ||
| − | * MIT | + | * MIT: Koen Van Leemput, Sylvain Jaume, Polina Golland |
| + | * Harvard: Steve Pieper, Ron Kikinis | ||
= Publications = | = Publications = | ||
| + | |||
| + | [http://www.na-mic.org/publications/pages/display?search=Projects%3ABayesianMRSegmentation+OR+Projects%3AHippocampalSubfieldSegmentation&submit=Search&words=all&title=checked&keywords=checked&authors=checked&abstract=checked&searchbytag=checked&sponsors=checked| NA-MIC Publications Database on Bayesian Segmentation of MRI Images] | ||
Latest revision as of 20:05, 11 May 2010
Home < Projects:BayesianMRSegmentationBack to NA-MIC Collaborations, MIT Algorithms
Bayesian Segmentation of MRI Images
Description
The aim of this project is to develop, implement, and validate a generic method for segmenting MRI images that automatically adapts to different acquisition sequences. Towards this end, we design parametric computational models of how MRI images are generated, and then use these models to obtain automated segmentations in a Bayesian framework.
The model we have developed incorporates a prior distribution that makes predictions about where neuroanatomical labels typically occur throughout an image, and is based on a generalization of probabilistic atlases that uses a deformable, compact tetrahedral mesh representation. The model also includes a likelihood distribution that predicts how a label image, where each voxel is assigned a unique neuroanatomical label, translates into an MRI image, where each voxel has an intensity.
Given an image to be segmented, we first estimate the parameters of the model that are most probable in light of the data. The parameter estimation involves finding the deformation that optimally warps the mesh-based probabilistic atlas onto the image under study, estimating MRI intensity inhomogeneities corrupting the image, as well as finding the mean intensity and the intensity variance for each of the structures to be segmented. Once these parameters are estimated, the most probable image segmentation is obtained.
Application to Hippocampal Subfield Segmentation
We have used our technique to automatically segment several subfields of the hippocampus directly from ultra-high resolution in vivo MRI data. Recent developments in MR data acquisition technology have started to yield images that show anatomical features of the hippocampal formation at an unprecedented level of detail, providing the basis for hippocampal subfield measurement. Because of the role of the hippocampus in human memory and its implication in a variety of disorders and conditions, the ability to reliably and efficiently quantify its subfields through in vivo neuroimaging is of great interest to both basic neuroscience and clinical research.
We have validated our technique by comparing our automated segmentation results with corresponding manual delineations in ultra-high resolution MRI scans (voxel size 0.38x0.38x0.80mm^3) of 10 individuals. For each of seven structures of interest (fimbria, CA1, CA2/3, CA4/DG, presubiculum, subiculum, and hippocampal fissure), we calculated the Dice overlap coefficient, defined as the volume of overlap between the automated and manual segmentation divided by their mean volume. We used a leave-one-out cross-validation strategy, in which we built an atlas mesh from the delineations in nine subjects, and used this to segment the image of the remaining subject. We repeated this process for each of the 10 subjects, and compared the automated segmentation results with the corresponding manual delineations.
Figure 1 compares the manual and automated segmentation results qualitatively on a set of cross-sectional slices. The upper half of figure 2 shows the average Dice overlap measure for each of the structures of interest, along with error bars that indicate the standard errors around the mean. The lower half of the figure shows, for each structure, the volume differences between the automated and manual segmentations relative to their mean volumes. An example of our mesh-based probabilistic atlas, derived from nine manually labeled hippocampi, is shown in figure 3.
Integration into Slicer
We are currently working on integrating our method into 3D Slicer. Our aim is to provide an implementation that is fast and intuitive enough to be useful in hospital environments.
Key Investigators
- MIT: Koen Van Leemput, Sylvain Jaume, Polina Golland
- Harvard: Steve Pieper, Ron Kikinis
Publications
NA-MIC Publications Database on Bayesian Segmentation of MRI Images


