Difference between revisions of "Projects:LongitudinalAtlasBuilding"
From NAMIC Wiki
(Created page with ' Back to UNC Algorithms __NOTOC__ = Longitudinal atlas building = As part of the longitudinal intra- and interpatient analysis theme within NA-MIC, we are wo…') |
|||
| Line 7: | Line 7: | ||
= Description = | = Description = | ||
| + | |||
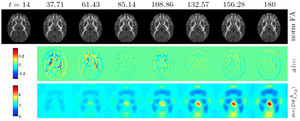
| + | [[Image:UNC_longitudinalAtlasEx1.png|thumb|300px|Longitudinal macaque developmental DTI atlas from postnatal day 14 to 180 as visualized on a center axial slice. Top row: Reconstructed atlas image at each age pulled back to day 14. The high quality of the longitudinal modeling is visible through the close similarity of the pulled-back atlas images. Middle row: Estimated change in FA between time points displaying major change occurring in the first 60 days (overshadowing the magnitude of later changes). Bottom row: Jacobian determinant of the pull-back deformation field. Cyan = no change, dark blue = growth (most of white matter), yellow-red = shrinkage (here seen on the 3rd ventricle in the center of the image) ]] | ||
Revision as of 19:41, 15 April 2011
Home < Projects:LongitudinalAtlasBuildingBack to UNC Algorithms
Longitudinal atlas building
As part of the longitudinal intra- and interpatient analysis theme within NA-MIC, we are working on a deformable, longitudinal DTI atlas method. Our initial approach is based on intensity calibrated images assuming homogenous intensity across the time scale. This longitudinal framework explicitly accounts for temporal dependencies via iterative subject-specific statistical growth modeling, and cross-sectional atlas-building. To effectively account for measurements sparse in time, a continuous-discrete statistical growth model is proposed incorporating also patient co-variates
Description

Longitudinal macaque developmental DTI atlas from postnatal day 14 to 180 as visualized on a center axial slice. Top row: Reconstructed atlas image at each age pulled back to day 14. The high quality of the longitudinal modeling is visible through the close similarity of the pulled-back atlas images. Middle row: Estimated change in FA between time points displaying major change occurring in the first 60 days (overshadowing the magnitude of later changes). Bottom row: Jacobian determinant of the pull-back deformation field. Cyan = no change, dark blue = growth (most of white matter), yellow-red = shrinkage (here seen on the 3rd ventricle in the center of the image)
Publications
Key Investigators
- UNC Algorithms: Marc Niethammer, Istvan Csapo, Yundi Shi, Martin Styner