Difference between revisions of "DBP3:Utah:AutoWallSeg"
| Line 87: | Line 87: | ||
Original data: [[File:Autoseg pairs.xlsx]] | Original data: [[File:Autoseg pairs.xlsx]] | ||
| + | |||
| + | ==Comparison with Epi Wall including Pulmonary Veins== | ||
| + | |||
| + | The preceding analysis was done with the final product wall from a manual segmentation session, which has all of the pulmonary veins removed. Pulmonary vein removal, however, is somewhat arbitrary and the GA Tech results don't incorporate vein removal in the process. To perform a more fair comparison, we did a second analysis using the wall segmentation with veins still attached (in our manual data we subtracted the endocardial segmentation from the epicardial segmentation). | ||
| + | |||
| + | ===Visual=== | ||
| + | {| class="wikitable" | ||
| + | |- | ||
| + | ! | ||
| + | ! good slice | ||
| + | ! bad slice | ||
| + | |- | ||
| + | | Best overlap | ||
| + | | [[File:Screen shot autoseg epi best good slice.png | thumb]] | ||
| + | | [[File:Screen shot autoseg epi best bad slice.png | thumb]] | ||
| + | |- | ||
| + | | Worst overlap | ||
| + | | [[File:Screen shot autoseg epi worst good slice.png | thumb]] | ||
| + | | [[File:Screen shot autoseg epi worst bad slice.png | thumb]] | ||
| + | |- | ||
| + | |} | ||
| + | |||
| + | ===Statistical=== | ||
| + | |||
| + | {| class="wikitable" | ||
| + | |- | ||
| + | | [[File:Autoseg overlap Boxplot all.png]] | ||
| + | | [[File:Autoseg overlap Boxplot post.png]] | ||
| + | | [[File:Autoseg overlap Boxplot pre.png]] | ||
| + | |- | ||
| + | |} | ||
| + | |||
| + | ===Timing=== | ||
| + | |||
| + | In release mode each automatic wall segmentation takes about 3-4 minutes. By comparison, a manual wall segmentation takes about 8 minutes. | ||
| + | |||
| + | A more detailed analysis gave the following timing results over our 73 patient cohort: | ||
| + | |||
| + | * mean duration: 223.98 sec (3 m 43 s) | ||
| + | * standard deviation: 46.43 sec | ||
| + | |||
| + | Note: This is time spent in user space, time spent in kernel space was ignored (usually less than a second). | ||
Revision as of 17:44, 14 October 2011
Home < DBP3:Utah:AutoWallSegContents
Automatic Segmentation
Automatic Wall Segmentation from GA Tech
GA Tech produced a slicer module to automatically segment the left atrial wall, given the original data AND the endo (blood pool) segmentation. Below is some evaluation of those segmentations.
Visual
(click on thumbnails to view full size)
Slice
| Auto, Endo, and Manaul Wall (01 3mo s5) | Auto, Endo, and Manual Wall (01 3mo s4) | Auto, Endo, and Manual Wall (01 3mo s1) | Auto, Endo, and 4 Pixel Dilation from Endo (01 3mo s1) |
|---|---|---|---|
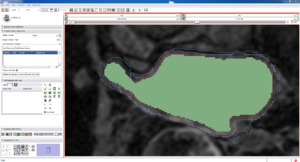
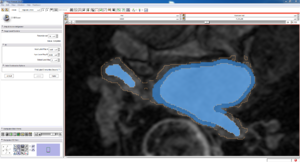
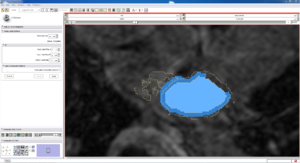
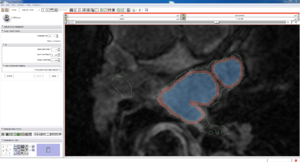
| This image shows how the automatic wall segmentation creates a complete surface around the endo - while a manual segmentor would cut off the wall around the veins (although the location this cutoff decision is arbitrary). | This image shows where the automatic segmentation surrounds a vein, while the manual segmentor decided to not surround the vein. | This image shows some island artifacts that may be the result of the process being done in 3D (leaking from the slice above) - note that the data below the islands is lighter. | Here we show a 4 pixel dilation from the endo compared to the automatic segmentation. This also image shows more islands. |
Isosurface
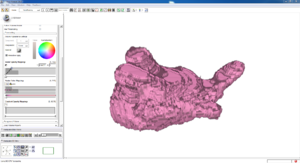
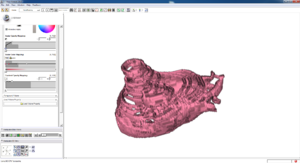
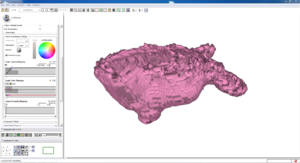
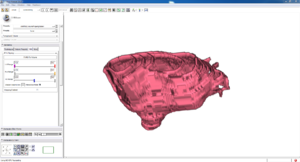
Note how the automatic segmentation creates a smooth/complete (mostly) surface on the top side of the atrium, while the bottom has gaps similar to the manual.
| Auto Wall Segmenation Isosurface (01 3mo s5) | Manual Wall Segmentation Isosurface (01 3mo s5) |
|---|---|
Comparison Statistics
Inter Auto Seg Comparison
Before getting the automatic wall segmentation code we had done a small study on our manual segmentations (see LA Segmentation reproducibility - intra and inter observer), this involved 64 total Endo + Wall Segmentations (4 different segmentors segmenting the same scan, for 16 scans).
To compare them we used the STAPLE algorithm to create a "ground truth" and then calculated overlap and accuracy, among other things, according to that ground truth.
We did the same analysis, but on the automatic wall segmentations (each derived from the different manual endo segmentations), and compared it to the original manual segmentation data.
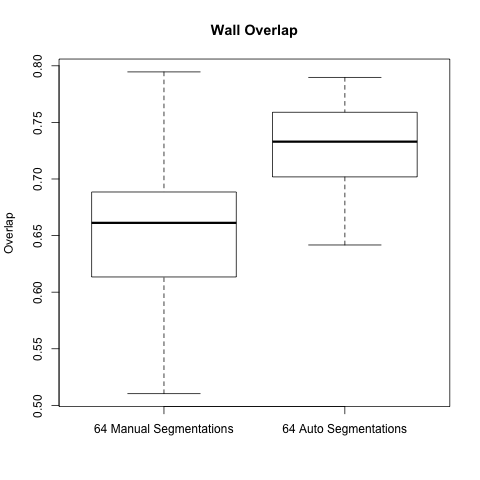
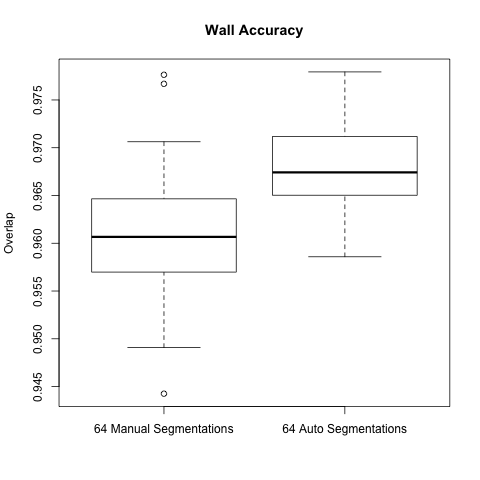
Below are boxplots of the two data sets, for both overlap and accuracy.
For two sets S1 and S2, overlap is computed: (2 * ||S1 ^ S2|| ) / ( ||S1|| + ||S2|| )
For two sets S1 and S2, accuracy is computed: (||S1 ^ S2|| + ||!S1 ^ !S2|| ) / (||S1|| + ||S2||)
(For brevity: ^ is intersection, U is union, and !S is the complement of S)
As the graphs show the automatic wall segmentations have much better overlap and accuracy with their STAPLE produced ground truths.
However the most these results seem to say is that the automatic algorithm is more consistent than manual segmentations. We hope to run a new comparison to be able to really evaluate the performance of the automatic segmentation.
A side note is that the manual segmentations are actually very consistent when compared to the automatic segmentations - one would expect the gap to be larger.
Original data: File:Autoseg.xlsx, File:Manual Compare Results.xlsx
Auto to Manual Overlap Comparison
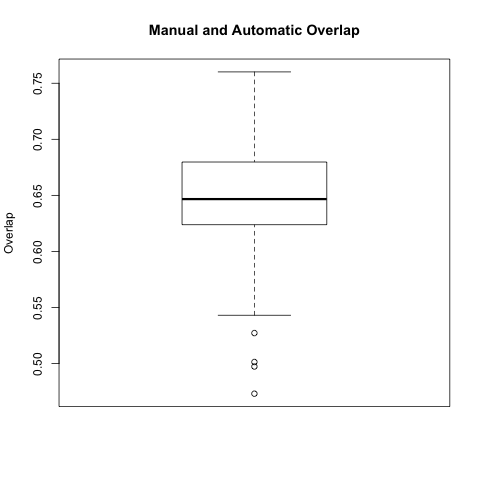
In this comparison we took each automatic segmentation produced using a manual endo segmentation and compared it with the corresponding manual wall segmentation.
The box plot below is for all 64 automatic-manual segmentation pairs.
Original data: File:Autoseg pairs.xlsx
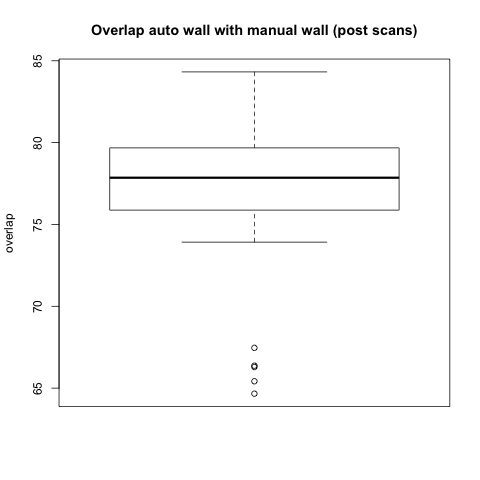
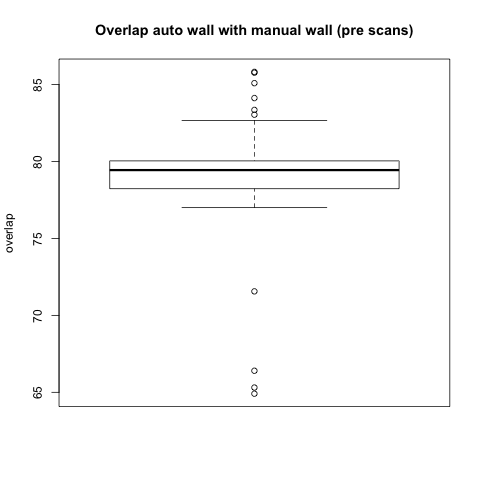
Comparison with Epi Wall including Pulmonary Veins
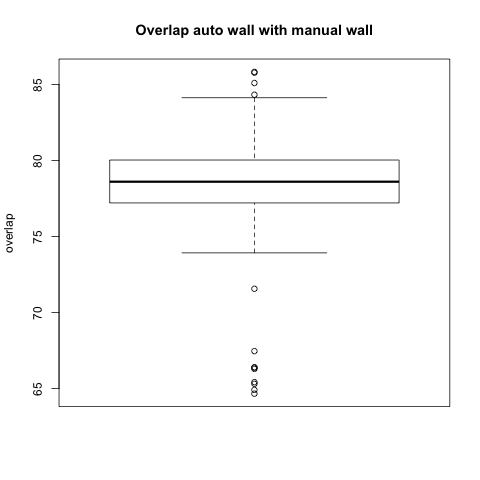
The preceding analysis was done with the final product wall from a manual segmentation session, which has all of the pulmonary veins removed. Pulmonary vein removal, however, is somewhat arbitrary and the GA Tech results don't incorporate vein removal in the process. To perform a more fair comparison, we did a second analysis using the wall segmentation with veins still attached (in our manual data we subtracted the endocardial segmentation from the epicardial segmentation).
Visual
| good slice | bad slice | |
|---|---|---|
| Best overlap | ||
| Worst overlap |
Statistical
|
|
|
Timing
In release mode each automatic wall segmentation takes about 3-4 minutes. By comparison, a manual wall segmentation takes about 8 minutes.
A more detailed analysis gave the following timing results over our 73 patient cohort:
- mean duration: 223.98 sec (3 m 43 s)
- standard deviation: 46.43 sec
Note: This is time spent in user space, time spent in kernel space was ignored (usually less than a second).
