Difference between revisions of "Projects:longitudinaldwi"
| (4 intermediate revisions by 2 users not shown) | |||
| Line 1: | Line 1: | ||
| + | Back to [[Algorithm:Utah2|Utah 2 Algorithms]] | ||
| + | __NOTOC__ | ||
| + | |||
= Longitudinal Analysis of DWI image data = | = Longitudinal Analysis of DWI image data = | ||
| Line 24: | Line 27: | ||
''Sylvain Gouttard, Marcel Prastawa, Elizabeth Bullitt, Casey Goodlett and Guido Gerig, Constrained Data Decomposition and Regression for Analyzing Healthy Aging from Fiber Tract Diffusion Properties, Springer LNCS 5761, Proc. MICCAI’09, pp. 321-328, 2009'' | ''Sylvain Gouttard, Marcel Prastawa, Elizabeth Bullitt, Casey Goodlett and Guido Gerig, Constrained Data Decomposition and Regression for Analyzing Healthy Aging from Fiber Tract Diffusion Properties, Springer LNCS 5761, Proc. MICCAI’09, pp. 321-328, 2009'' | ||
| + | |||
| Line 29: | Line 33: | ||
---- | ---- | ||
| − | == | + | |
| + | |||
| + | == Growth Modeling of Longitudinal DT-MRI == | ||
This research presents a framework to model growth trajectories and to determine significant regional differences in growth pattern characteristics, applied to longitudinal neuroimaging data. We use nonlinear mixed effect modeling where temporal change is modeled by the Gompertz function. The Gompertz function uses intuitive parameters related to delay, rate of change, and expected asymptotic value; all descriptive measures which can answer clinical questions related to growth. Our proposed framework combines nonlinear modeling of individual trajectories, population analysis, and testing for regional differences. We will apply this framework to longitudinal DTI studies of NA-MIC DBP partners, which include acute/follow-up DTI in TBI and serial DTI in the Huntington Diseases PREDICT project, where thee time-points will be available. | This research presents a framework to model growth trajectories and to determine significant regional differences in growth pattern characteristics, applied to longitudinal neuroimaging data. We use nonlinear mixed effect modeling where temporal change is modeled by the Gompertz function. The Gompertz function uses intuitive parameters related to delay, rate of change, and expected asymptotic value; all descriptive measures which can answer clinical questions related to growth. Our proposed framework combines nonlinear modeling of individual trajectories, population analysis, and testing for regional differences. We will apply this framework to longitudinal DTI studies of NA-MIC DBP partners, which include acute/follow-up DTI in TBI and serial DTI in the Huntington Diseases PREDICT project, where thee time-points will be available. | ||
| Line 41: | Line 47: | ||
''N. Sadeghi, M. Prastawa, J. H. Gilmore, W. Lin, and G. Gerig, "Spatio-Temporal Analysis of Early Brain Development," in Proceedings IEEE Asilomar Conference on Signals, Systems & Computers, Nov. 2010, in print'' | ''N. Sadeghi, M. Prastawa, J. H. Gilmore, W. Lin, and G. Gerig, "Spatio-Temporal Analysis of Early Brain Development," in Proceedings IEEE Asilomar Conference on Signals, Systems & Computers, Nov. 2010, in print'' | ||
| + | |||
| Line 47: | Line 54: | ||
== Application to longitudinal DTI in Huntington Disease == | == Application to longitudinal DTI in Huntington Disease == | ||
| − | |||
| + | During the NAMIC Winter project week, we worked on registering subjects with Huntington's disease in the same coordinate space as control subjects. We then applied the framework by [http://ieeexplore.ieee.org/xpl/login.jsp?tp=&arnumber=6235829&url=http%3A%2F%2Fieeexplore.ieee.org%2Fxpls%2Fabs_all.jsp%3Farnumber%3D6235829 Sharma et al. ISBI'12] to quantify the differences in normal expected aging versus the accelerated white matter changes expected in HD. Details of the data pre-processing steps and image registration are available on the [http://www.na-mic.org/Wiki/index.php/2012_Winter_Project_Week:_DTI_Change_Modeling Winter AHM page] and the [http://www.na-mic.org/Wiki/index.php/Projects:TractLongitudinalDTI NAMIC Utah 2 Algorithms page]. Some results are summarized here for FA profile along the genu tract. | ||
| + | |||
| + | Two subjects- one being a HD patient (10027) with a high burden factor (higher factor value (of factor 12) implying that the subjects is closer to the onset) and the other being a control subject (10004) are chosen for concept demonstration. Both have a similar baseline scan age (42 and 43 years respectively) as well as a similar time separation between follow up scans. This allows an intuitive comparison of the estimated growth trajectories. | ||
| + | |||
| + | |||
| + | {| border="0" style="background:transparent;" | ||
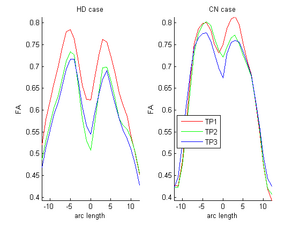
| + | |[[Image:ORIG_hd_cn.png|thumb|300px|center|FA curves corresponding to the genu tract (middle clipped portions) for one HD case (10027) and one control case (10004). Visual inspection clearly shows the huge decrease relative to the Control in the HD subject. On the other hand, the control shows normal expected decrease due to aging. Red-timepoint 1, Green-timepoint 2, Blue-timepoint 3. The left is HD case and the right plot is Control.]] | ||
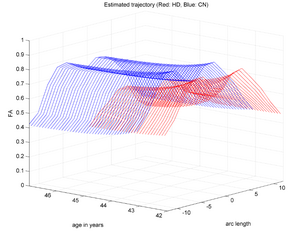
| + | |[[Image:HD_vs_CN_3d.png|thumb|300px|center|The red trajectory corresponds the the HD subjects while the blue is a control subject with healthy aging. HD patient clearly shows a much sharper FA decrease along time than the Control.]] | ||
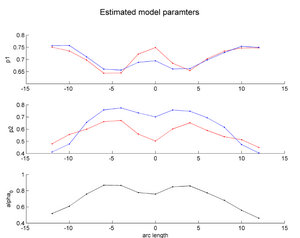
| + | |[[Image:HD_vs_CN_params.png|thumb|300px|center|The estimated model parameters (Red-HD case, Blue-Control case) for the two subjects. The top plot is the rate of change per unit time, per unit FA value. The middle plot is the function asymptote and the last plot is the common baseline curve estimation for providing a common reference frame for model estimation and comparison. The asymptote clearly shows a much lower FA range for HD when compared to the Control which already shows promising early prediction capabilities for HD cases where white matter decay is much faster than healthy patients. Also, a higher per unit rate of change quantifies the sharper FA decrease compared to control.]] | ||
| + | |- | ||
| + | |} | ||
| + | |||
| + | ''Sharma, A., Durrleman, S. , Gilmore, J.H. , Gerig, G. Longitudinal growth modeling of discrete-time functions with application to DTI tract evolution in early neurodevelopment. Proc. of 9th IEEE International Symposium on Biomedical Imaging (ISBI May'12), p.1397-1400.'' | ||
---- | ---- | ||
Latest revision as of 12:02, 19 August 2012
Home < Projects:longitudinaldwiBack to Utah 2 Algorithms
Longitudinal Analysis of DWI image data
Description
Subject-specific analysis of image data often includes comparison of follow-up to baseline, or serial staging of progress of disease or for monitoring therapeutic intervention. Key methodological components are intra-subject registration of the set of scans, and analysis of geometric deformations and appearance changes. In DWI data, such analysis includes deformation of the set of DWI with associated correction of tensor orientation or local ODF adjustement. In addition, scalar invariants such as FA, MD, axial and radial diffusivities have to be compared in regions or along tracts at corresponding anatomical locations.
The availability of longitudinal or serial 3D image data for each subject, the image processing gets new opportunities for spatio-temporal processing of 4D datasets. The conventional cross-sectional comparison between subjects are groups at various time points is replaced by comparison and analysis of subject-specific change trajectories. In this project, we focus on the development of longitudinal analysis of DTI.
Constrained Data Decomposition and Regression for Longitudinal Fiber Tract Diffusion
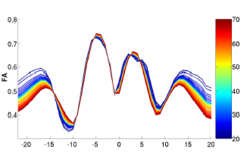
We have developed a methodology based on constrained PCA (CPCA) for fitting age-related changes of white matter diffusion of fiber tracts. CPCA is applied to a functional data analysis (FDA) problem, where diffusion along parametrized fiber tracts, e.g. FA or MD, represent functions of arc-length. Age regression on tract functions reveals a nonlinear trajectory but also age-related changes varying locally along tracts.
Sylvain Gouttard, Marcel Prastawa, Elizabeth Bullitt, Casey Goodlett and Guido Gerig, Constrained Data Decomposition and Regression for Analyzing Healthy Aging from Fiber Tract Diffusion Properties, Springer LNCS 5761, Proc. MICCAI’09, pp. 321-328, 2009
Growth Modeling of Longitudinal DT-MRI
This research presents a framework to model growth trajectories and to determine significant regional differences in growth pattern characteristics, applied to longitudinal neuroimaging data. We use nonlinear mixed effect modeling where temporal change is modeled by the Gompertz function. The Gompertz function uses intuitive parameters related to delay, rate of change, and expected asymptotic value; all descriptive measures which can answer clinical questions related to growth. Our proposed framework combines nonlinear modeling of individual trajectories, population analysis, and testing for regional differences. We will apply this framework to longitudinal DTI studies of NA-MIC DBP partners, which include acute/follow-up DTI in TBI and serial DTI in the Huntington Diseases PREDICT project, where thee time-points will be available.
N. Sadeghi, M. Prastawa, J. H. Gilmore, W. Lin, and G. Gerig, "Spatio-Temporal Analysis of Early Brain Development," in Proceedings IEEE Asilomar Conference on Signals, Systems & Computers, Nov. 2010, in print
Application to longitudinal DTI in Huntington Disease
During the NAMIC Winter project week, we worked on registering subjects with Huntington's disease in the same coordinate space as control subjects. We then applied the framework by Sharma et al. ISBI'12 to quantify the differences in normal expected aging versus the accelerated white matter changes expected in HD. Details of the data pre-processing steps and image registration are available on the Winter AHM page and the NAMIC Utah 2 Algorithms page. Some results are summarized here for FA profile along the genu tract.
Two subjects- one being a HD patient (10027) with a high burden factor (higher factor value (of factor 12) implying that the subjects is closer to the onset) and the other being a control subject (10004) are chosen for concept demonstration. Both have a similar baseline scan age (42 and 43 years respectively) as well as a similar time separation between follow up scans. This allows an intuitive comparison of the estimated growth trajectories.
Sharma, A., Durrleman, S. , Gilmore, J.H. , Gerig, G. Longitudinal growth modeling of discrete-time functions with application to DTI tract evolution in early neurodevelopment. Proc. of 9th IEEE International Symposium on Biomedical Imaging (ISBI May'12), p.1397-1400.
Key Investigators
- Utah: Anuja Sharma, Sylvain Gouttard, Guido Gerig
- IOWA: Hans Johnson


