Difference between revisions of "Projects:RiskMassEstimation"
| (3 intermediate revisions by one other user not shown) | |||
| Line 1: | Line 1: | ||
| − | Back to [[Algorithm: | + | Back to [[Algorithm:Stony Brook|Stony Brook University Algorithms]] |
__NOTOC__ | __NOTOC__ | ||
| Line 14: | Line 14: | ||
Left: Correlation analysis. Right: Bland-Altman plot for %LV of CTA vs. SPECT | Left: Correlation analysis. Right: Bland-Altman plot for %LV of CTA vs. SPECT | ||
| − | |||
= Key Investigators = | = Key Investigators = | ||
*Georgia Tech: Liangjia Zhu and Anthony Yezzi | *Georgia Tech: Liangjia Zhu and Anthony Yezzi | ||
| Line 21: | Line 20: | ||
= Publications = | = Publications = | ||
| + | L. Zhu, Y. Gao, A. Yezzi, C. Arepalli , A. Stillman, and A. Tannenbaum. A Computational Framework for Estimating the Mass at Risk Caused by Stenoses using CT Angiography, Internatial Journal of Cardiac Imaging(IJCI), In preparation. | ||
| + | |||
| + | L. Zhu, Y. Gao, V. Mohan, A. Stillman, T. Faber, A. Tannenbaum. Estimation of myocardial volume at risk from CT angiography, Proceedings of SPIE , pp.79632-38A, 2011. | ||
Latest revision as of 01:04, 16 November 2013
Home < Projects:RiskMassEstimationBack to Stony Brook University Algorithms
Description
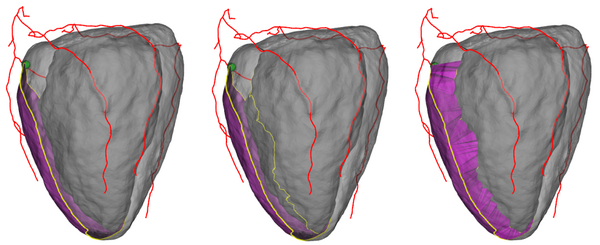
The proposed method has three major components: First, extract the coronary arteries from CTA image and identify stenoses with severe occlusions. Second, segment the left ventricular surfaces from CTA image. Third, estimate the affected mass based on the segmentations of the arteries and left ventricle. These steps are illustrated in the figure below.
Volume at risk estimation process. Left: Extract the area at risk (purple) on the epicardial surface given the stenosis location (greed dot) on the coronary arteries (red lines). Middle: Trace out the risk contour (yellow) on the endocardial surface. Right: Construct the volume at risk (purple).
Results
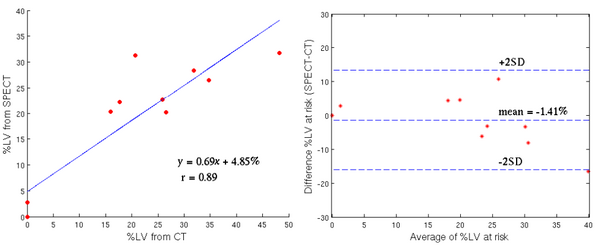
In experiments, 11 human cardiac CTA images were used to validate the proposed computational framework. In addition, a comparison was made between the percentage of the myocardial mass at risk estimated from CTA images with their corresponding values determined from SPECT MPI.
Left: Correlation analysis. Right: Bland-Altman plot for %LV of CTA vs. SPECT
Key Investigators
- Georgia Tech: Liangjia Zhu and Anthony Yezzi
- BWH: Yi Gao
- Boston University: Allen Tannenbaum
Publications
L. Zhu, Y. Gao, A. Yezzi, C. Arepalli , A. Stillman, and A. Tannenbaum. A Computational Framework for Estimating the Mass at Risk Caused by Stenoses using CT Angiography, Internatial Journal of Cardiac Imaging(IJCI), In preparation.
L. Zhu, Y. Gao, V. Mohan, A. Stillman, T. Faber, A. Tannenbaum. Estimation of myocardial volume at risk from CT angiography, Proceedings of SPIE , pp.79632-38A, 2011.

