Difference between revisions of "3D SIFT VIEW"
From NAMIC Wiki
| Line 6: | Line 6: | ||
</gallery> | </gallery> | ||
| − | == | + | ==New Visualization== |
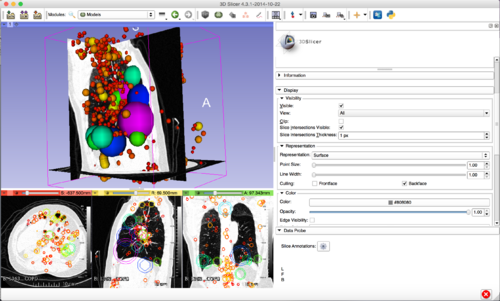
[[File:3D_SIFT_Lung.png|500px|thumb|left|alt text]] | [[File:3D_SIFT_Lung.png|500px|thumb|left|alt text]] | ||
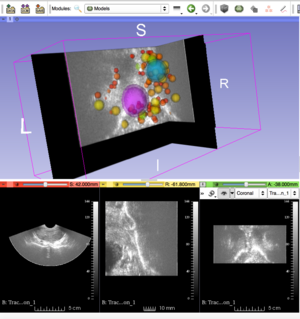
[[File:3D_SIFT_Prostate.png|300px|thumb|left|alt text]] | [[File:3D_SIFT_Prostate.png|300px|thumb|left|alt text]] | ||
Revision as of 00:30, 9 January 2015
Home < 3D SIFT VIEWNew Visualization
Key Investigators
- Matthew Toews, Raul San Jose, Steve Pieper, Nicole Aucoin, Lauren O'Donnell, Andriy Fedorov, William Wells BWH
Code
Python conversion code Media:3D_SIFT_VISUALIZATION.gz
Project Description
Objective
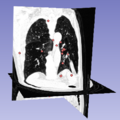
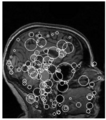
- Generate effective visualizations for 3D SIFT feature sets in Slicer.
Approach, Plan
- Investigate methods for visualizing 3D feature location, scale, orientation and group label (e.g. diseased, healthy)
- Location, scale: spheres (markups), group labels: color/transparency
- Visualization: Slicer Python module based on Slicer Markups
- Data preparation: c++
Progress
- Evaluated Slicer fiducials and VTK glyph models for feature display
- Developed a python script to convert a 3D SIFT feature file into a VTK model (thanks Lauren, Nicole)
- ToDo:
- display feature orientation (possibly as another glyph)
- display varying feature opacity


