Difference between revisions of "Project Week 25/SALT Spatiotemporal Modeling:"
Jfishbaugh (talk | contribs) |
|||
| (23 intermediate revisions by 3 users not shown) | |||
| Line 15: | Line 15: | ||
|- style="vertical-align:top;" | |- style="vertical-align:top;" | ||
|<!-- Objective bullet points --> | |<!-- Objective bullet points --> | ||
| − | Slicer Shape AnaLysis Toolbox (SlicerSALT) is a standalone version of Slicer specifically for shape analysis, currently under development. One aspect of the project is the validation of the tools to be included in SlicerSALT. In this project, we will begin validating the shape regression component with a longitudinal database of subcortical structures. | + | * Slicer Shape AnaLysis Toolbox ([http://github.com/Kitware/SlicerSALT SlicerSALT]) is a standalone version of Slicer specifically for shape analysis, currently under development. One aspect of the project is the validation of the tools to be included in SlicerSALT. In this project, we will begin validating the shape regression component with a longitudinal database of subcortical structures. |
| + | |||
| + | * The longitudinal infant data has been collected as part of the NIH funded UNC Psychiatry CONTE project to study early brain development in infants at risk for mental illness (PI [https://www.med.unc.edu/psych/earlybraindevresearch/people/principal-investigators/john-gilmore John H. Gilmore]), Distinguished Professor, Director of the Early Brain Development Program, UNC Chapel Hill, Department of Psychiatry). | ||
|<!-- Approach and Plan bullet points --> | |<!-- Approach and Plan bullet points --> | ||
| + | |||
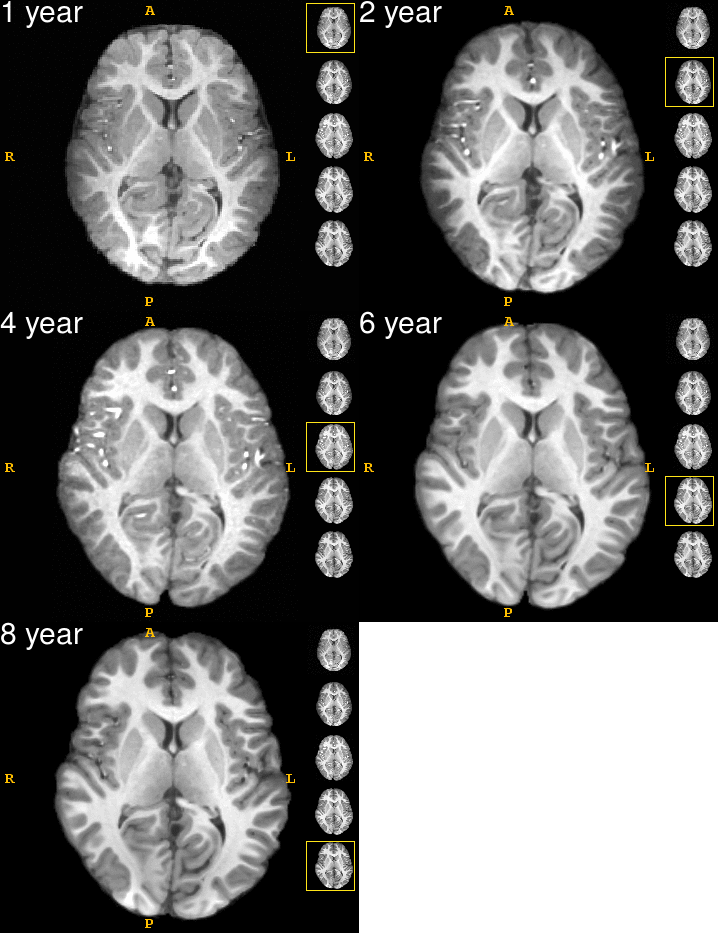
| + | * Longitudinal dataset consists of 553 subjects with a total of 1530 scans. MR images are acquired at clustered ages of 1, 2, 4, 6, 8, and 10 years of age. Subjects commonly have missing data points, though many subjects have 3 or more more scans. | ||
| + | |||
| + | * We focus this week on getting the data organized, setting up the processing pipeline, as well as estimating a model for a single subject. We would also like to identify Slicer tools that are helpful for our analysis, to be considered for inclusion in Slicer SALT. | ||
| + | |||
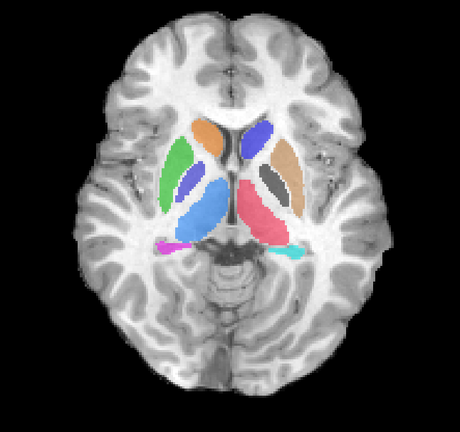
| + | * Subcortical structures were segmented from infant MRI by the UNC Chapel Hill Psychiatry [https://www.med.unc.edu/psych/research/niral NIRAL] group of Martin Styner. Procedures included multi-atlas segmentation developed by NIRAL in collaboration with partner groups. | ||
| + | |||
|<!-- Progress and Next steps (fill out at the end of project week), bullet points --> | |<!-- Progress and Next steps (fill out at the end of project week), bullet points --> | ||
| + | |||
| + | * We found that subject data is not aligned across time; the observations do not share a common coordinate system. For a given set of images, we used Slicer to place a fiducial in each image space. We then used a linear transform to manually move one fiducial onto the other, using the 3D view as a visual guide. The linear transform was used as an initialization for rigid registration (BRAINS) in Slicer, to compute the final rigid transformation between images. We use the image when the child is oldest as the fixed image, and register the rest of the time-series to this reference. | ||
| + | |||
| + | * Subcortical structures are extracted via marching cubes, found in the [https://github.com/BioMedIA/MIRTK MIRTK] package. | ||
| + | |||
| + | * Shapes are decimated and smoothed using [http://www.meshlab.net/ Meshlab]. | ||
| + | |||
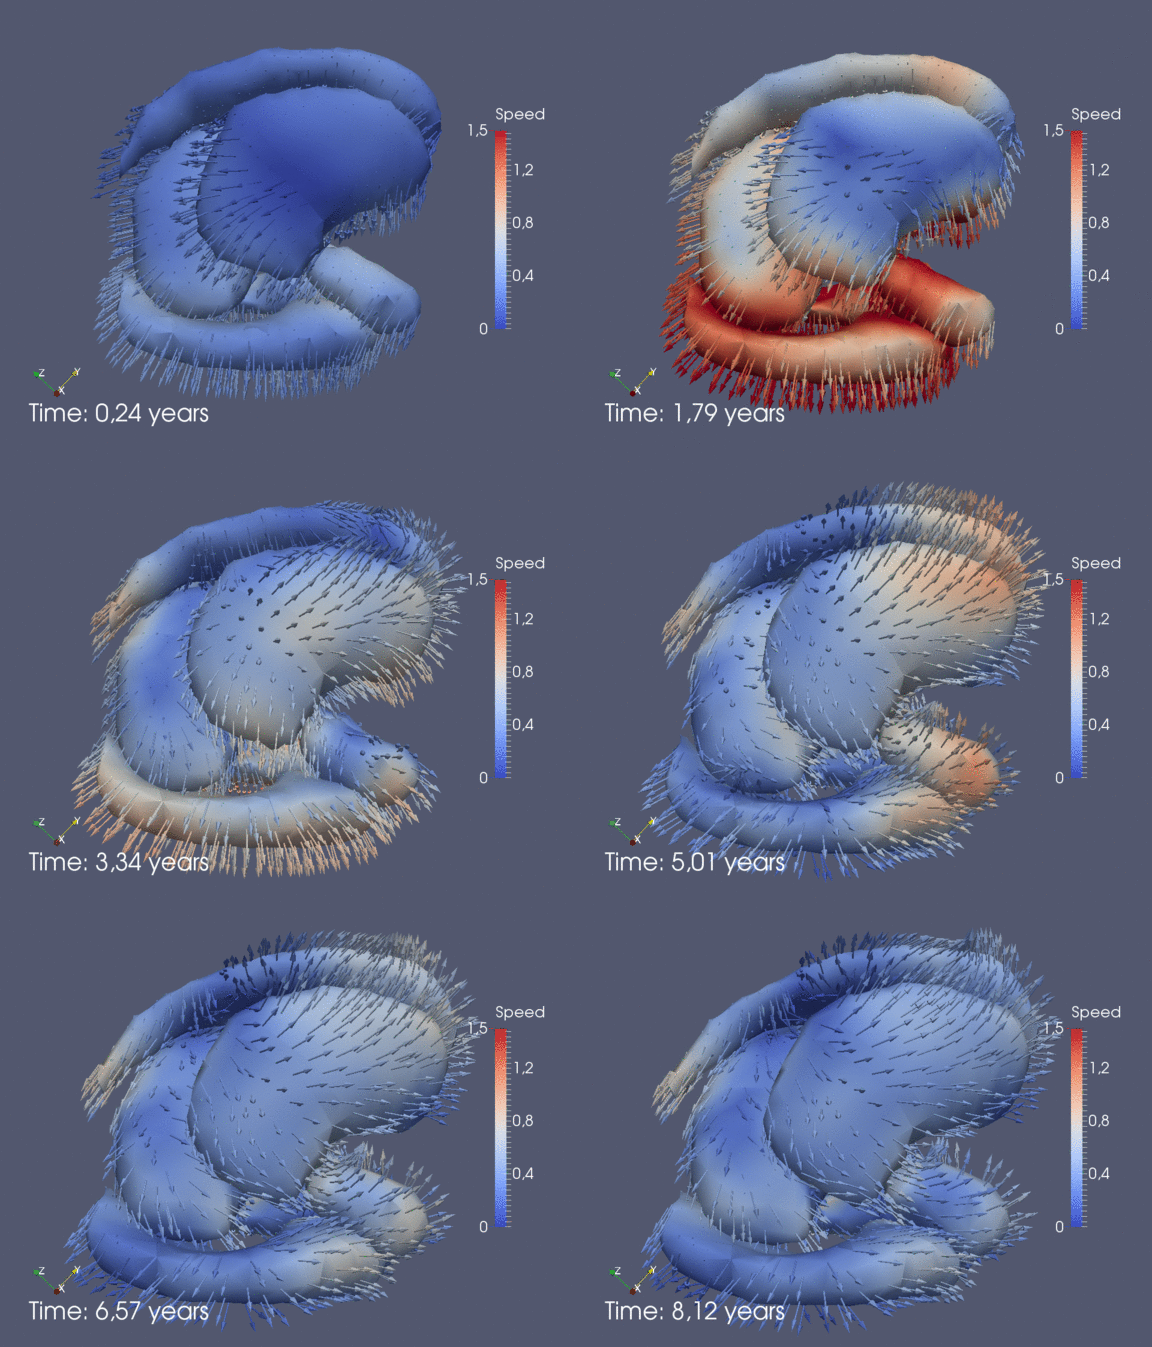
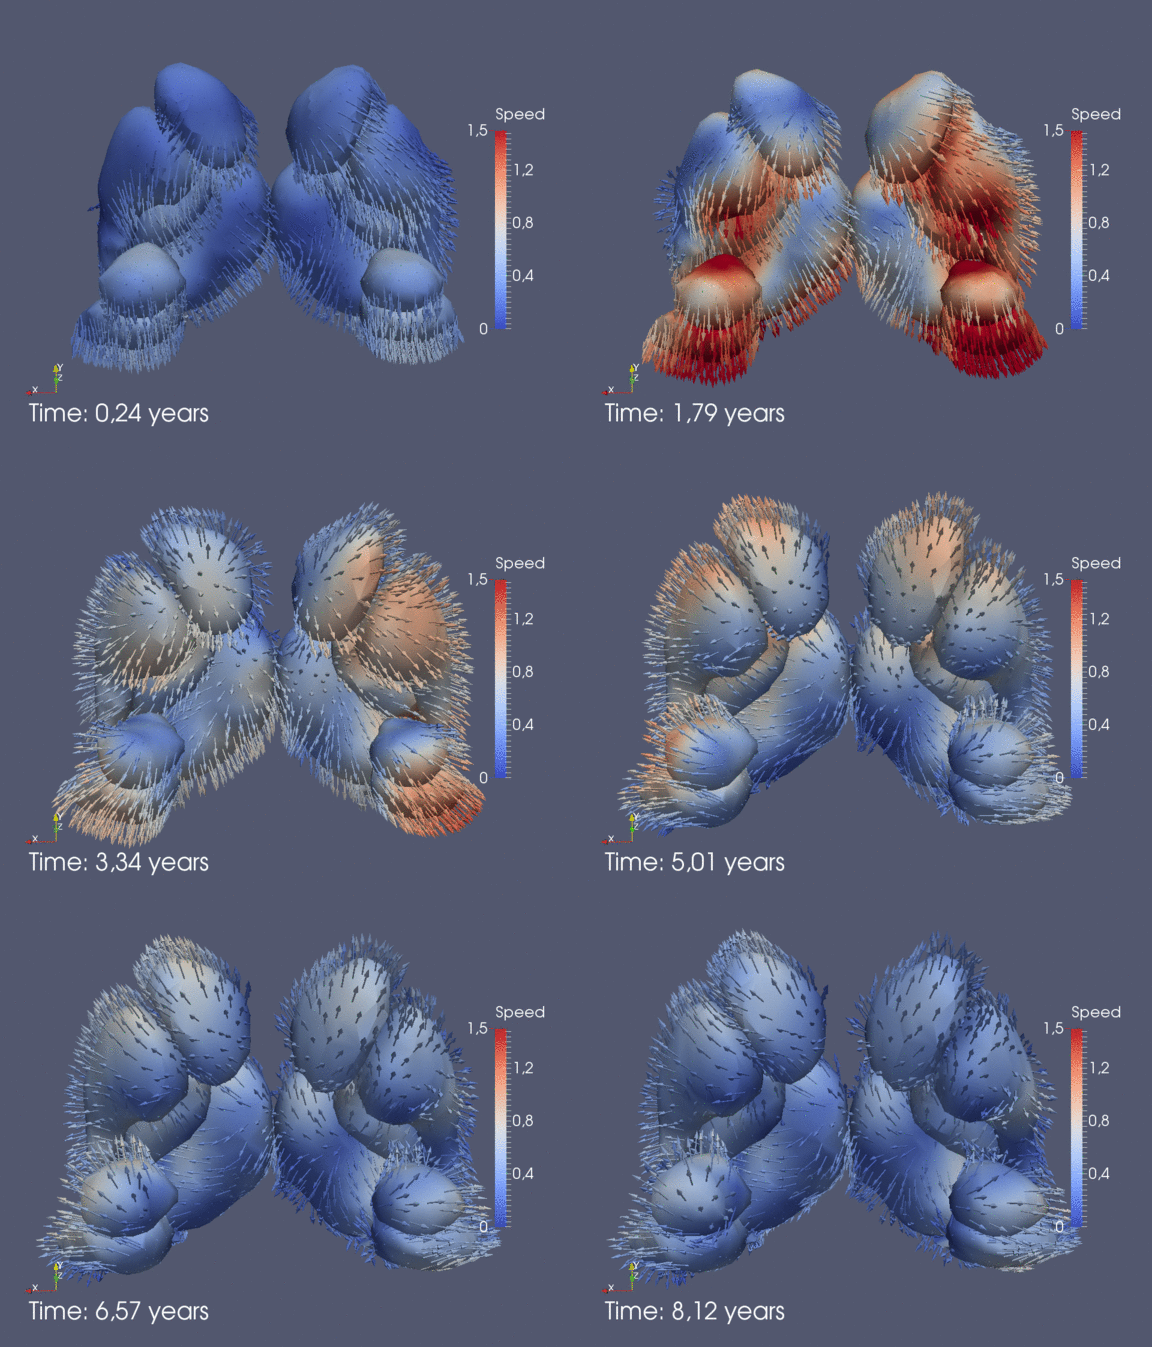
| + | * A spatiotemporal model was estimated for a single subject with 5 observations using [https://github.com/jamesfishbaugh/shape4D shape4d]. | ||
| + | |||
| + | * Andras mentioned the sequences module can provide similar functionality to Paraview, which is something to keep in mind for including in Slicer SALT. | ||
|} | |} | ||
==Illustrations== | ==Illustrations== | ||
| + | Left: Acquisitions of a single subject with observations at 1, 2, 4, 6, and 8 years old. Right: Sub-cortical structures are segmented for each time point. | ||
| + | {| | ||
| + | |- | ||
| + | | [[File:Observations_in_time.gif|600px]] || [[File:8yr_with_labels.png|460px]] | ||
| + | |} | ||
| + | |||
| + | <br> | ||
| + | Continuous spatiotemporal model of all subcortical structures from 0 to 8 years of age. Color denotes speed in mm/year, with vectors showing direction of growth. Two views of the same growth trajectory is shown below, from the side and from the front. | ||
| + | |||
| + | {| | ||
| + | |- | ||
| + | | http://research.engineering.nyu.edu/~fishbaugh/docs/anim_glyphs_side_small.gif || http://research.engineering.nyu.edu/~fishbaugh/docs/anim_glyphs_front_small.gif | ||
| + | |} | ||
| + | |||
==Background and References== | ==Background and References== | ||
<!-- Use this space for information that may help people better understand your project, like links to papers, source code, or data --> | <!-- Use this space for information that may help people better understand your project, like links to papers, source code, or data --> | ||
| + | [1] Fishbaugh, J., Durrleman, S., Prastawa, M., Gerig, G. Geodesic shape regression with multiple geometries and sparse parameters. Medical Image Analysis. Vol 39. pp. 1-17. (2017) | ||
| + | |||
| + | [2] Fishbaugh, J., Durrleman, S., Gerig, G. Estimation of smooth growth trajectories with controlled acceleration from time series shape data. Proc. of Medical Image Computing and Computer Assisted Intervention (MICCAI '11). Vol 6892, pp. 401-408. (2011) | ||
| + | |||
*[http://github.com/Kitware/SlicerSALT SlicerSALT] | *[http://github.com/Kitware/SlicerSALT SlicerSALT] | ||
Latest revision as of 13:39, 30 June 2017
Home < Project Week 25 < SALT Spatiotemporal Modeling:
Back to Projects List
Key Investigators
- James Fishbaugh (NYU Tandon School of Engineering, USA)
- Guido Gerig (NYU Tandon School of Engineering, USA)
Project Description
| Objective | Approach and Plan | Progress and Next Steps |
|---|---|---|
|
|
|
Illustrations
Left: Acquisitions of a single subject with observations at 1, 2, 4, 6, and 8 years old. Right: Sub-cortical structures are segmented for each time point.
 |

|
Continuous spatiotemporal model of all subcortical structures from 0 to 8 years of age. Color denotes speed in mm/year, with vectors showing direction of growth. Two views of the same growth trajectory is shown below, from the side and from the front.
 |

|
Background and References
[1] Fishbaugh, J., Durrleman, S., Prastawa, M., Gerig, G. Geodesic shape regression with multiple geometries and sparse parameters. Medical Image Analysis. Vol 39. pp. 1-17. (2017)
[2] Fishbaugh, J., Durrleman, S., Gerig, G. Estimation of smooth growth trajectories with controlled acceleration from time series shape data. Proc. of Medical Image Computing and Computer Assisted Intervention (MICCAI '11). Vol 6892, pp. 401-408. (2011)