Difference between revisions of "Slicer3:FourDAnalysis"
m (Text replacement - "http://www.slicer.org/slicerWiki/index.php/" to "https://www.slicer.org/wiki/") |
|||
| (3 intermediate revisions by one other user not shown) | |||
| Line 1: | Line 1: | ||
| − | |||
| − | |||
| − | |||
| − | |||
| − | |||
| − | |||
=Introduction= | =Introduction= | ||
The 4D Analysis Module allows you to load, visualize and analyze a time-series of 3D images (4D image) on [http://www.slicer.org/ 3D Slicer]. Currently, the module offers the following functions: | The 4D Analysis Module allows you to load, visualize and analyze a time-series of 3D images (4D image) on [http://www.slicer.org/ 3D Slicer]. Currently, the module offers the following functions: | ||
| Line 11: | Line 5: | ||
*'''Intensity plot.''' The module can draw intensity curve at the specified region of interest. | *'''Intensity plot.''' The module can draw intensity curve at the specified region of interest. | ||
*'''Series registration.''' The module provides a user-interface to perform image registration for each frame with a key frame. This function is useful if you want to perform intensity curve analysis on a series of images of an organ moving through the frames. | *'''Series registration.''' The module provides a user-interface to perform image registration for each frame with a key frame. This function is useful if you want to perform intensity curve analysis on a series of images of an organ moving through the frames. | ||
| + | <center> | ||
| + | {| | ||
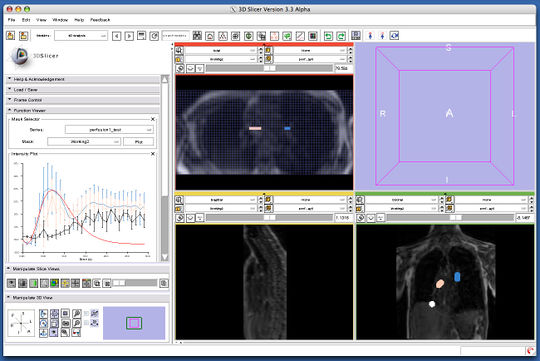
| + | |[[Image:3DSlicerFourDAnalysis_Screenshot.png|thumb|540px|Screenshot of 4D Analysis Module for lung perfusion data. The module provides several functionality to analyze intensity variation in specified regions of interest, including plotting and curve fitting.]] | ||
| + | |} | ||
| + | </center> | ||
=Installation= | =Installation= | ||
| − | Currently, the module is only available in the NAMICSandBox repository. Before you start, you need to have the latest 3D Slicer built from the source code. Please follow [ | + | |
| + | <font color="red">NOTE: The 4D Analysis module will become '''4D Image''' and '''4D Analysis''' modules in Slicer 3.5 soon. Please refer [https://www.slicer.org/wiki/Modules:FourDImage-Documentation-3.5 4D Image Module Page] and [https://www.slicer.org/wiki/Modules:FourDAnalysis-Documentation-3.5 4D Analysis Module Page] for the latest information. </font> | ||
| + | |||
| + | |||
| + | Currently, the module is only available in the NAMICSandBox repository. Before you start, you need to have the latest 3D Slicer built from the source code. Please follow [https://www.slicer.org/wiki/Slicer3:Build_Instructions the instruction] to build 3D Slicer in you environment. | ||
To install 4D Analysis Module in your 3D Slicer, first obtain the source code and put it into the modules' source directory: | To install 4D Analysis Module in your 3D Slicer, first obtain the source code and put it into the modules' source directory: | ||
Latest revision as of 17:43, 10 July 2017
Home < Slicer3:FourDAnalysisIntroduction
The 4D Analysis Module allows you to load, visualize and analyze a time-series of 3D images (4D image) on 3D Slicer. Currently, the module offers the following functions:
- 4D image loader. The module can load up a series of 3D images from a specified directory. It analyzes DICOM header of the files in the directory and split them into time-frames, even if all frames have the same series number (some MRI scanners generates time-series images without incrementing series number, resulting a large number (typically several thousands) of 2D image files output in a single directory). The module can also read a directory, which contains NRRD files.
- Time scroll. The module provides a scroll-bar interface to scroll the frame in time-direction. It allows you to scroll the frame for foreground and background screens independently to compare two images at the different time points.
- Intensity plot. The module can draw intensity curve at the specified region of interest.
- Series registration. The module provides a user-interface to perform image registration for each frame with a key frame. This function is useful if you want to perform intensity curve analysis on a series of images of an organ moving through the frames.
Installation
NOTE: The 4D Analysis module will become 4D Image and 4D Analysis modules in Slicer 3.5 soon. Please refer 4D Image Module Page and 4D Analysis Module Page for the latest information.
Currently, the module is only available in the NAMICSandBox repository. Before you start, you need to have the latest 3D Slicer built from the source code. Please follow the instruction to build 3D Slicer in you environment.
To install 4D Analysis Module in your 3D Slicer, first obtain the source code and put it into the modules' source directory: (Suppose you compile Slicer under <working directory>)
 cd <working directory>/Slicer3/Modules
 svn co http://svn.na-mic.org/NAMICSandBox/trunk/FourDAnalysis FourDAnalysis
Then edit CMakeFiles.txt in the Modules directory. Around line 69 (at the end of subdir()), insert the following code:
   ....
   ModelIntoLabelVolume
   FourDAnalysis                       <- this line!!
 )
Go to the module directory in the build directory, and run make to configure and build the module.
 cd <working directory>/Slicer3-build/Modules
 make
If the module is successfully compiled, the module should be in the module menu of 3D Slicer.
Usage
Plans
- Functions:
- Curve fitting
- Implemented as Python scripts (using SciPy)
- Users are allowed to edit the Python scripts
- Parameter map
- Perform curve fitting for each voxel
- Generate parameter map volume
- Curve fitting
People
- Junichi Tokuda, PhD (BWH)
- Hiroto Hatabu, MD, PhD (BWH)
Acknowledgements
This work is supported by NIH (5R21CA116271: Dynamic contrast-enhanced MRI of pulmonary nodule at 3T, PI: Hiroto Hatabu), NA-MIC, and NCIGT.
