Difference between revisions of "Projects:MultiscaleShapeAnalysis"
| (14 intermediate revisions by 4 users not shown) | |||
| Line 1: | Line 1: | ||
| − | Back to [[NA- | + | Back to [[NA-MIC_Internal_Collaborations:StructuralImageAnalysis|NA-MIC Collaborations]], [[Algorithm:Stony Brook|Stony Brook University Algorithms]], [[Algorithm:UNC|UNC Algorithms]], [[DBP1:Harvard|Harvard DBP1]] |
| + | __NOTOC__ | ||
= Multiscale Shape Analysis applied to Caudate and Hippocampus = | = Multiscale Shape Analysis applied to Caudate and Hippocampus = | ||
| Line 11: | Line 12: | ||
[[Image:UNCShape_OverviewAnalysis_MICCAI06.gif|thumb|right|300px|]] | [[Image:UNCShape_OverviewAnalysis_MICCAI06.gif|thumb|right|300px|]] | ||
| − | We use the [[ | + | We use the [[Projects:ShapeAnalysisFrameworkUsingSPHARMPDM|UNC Pipeline]] to pre-process the shapes. The input is a set of binary segmentation of a single brain structure. We use the following steps from the pipeline: |
# Morphological operations: fills any interior holes and applies a minimal smoothing operation | # Morphological operations: fills any interior holes and applies a minimal smoothing operation | ||
| Line 27: | Line 28: | ||
''Statistics'' | ''Statistics'' | ||
| − | We use the UNC [[ | + | We use the UNC [[Projects:LocalStatisticalAnalysisViaPermutationTests |statistical test toolbox]] that analyzes differences between two groups of surfaces described by a set of features. The group differences are computed locally for every feature using the standard robust Hotelling T^2 two sample metric. Statistical p-values, both raw and corrected for multiple comparisons are given as output. The toolbox outputs a global average P-value for all features, as well as a raw and corrected P-value for each feature. We use the 3D spherical wavelet coefficients as features. |
''Significance Maps'' | ''Significance Maps'' | ||
| Line 39: | Line 40: | ||
= Key Investigators = | = Key Investigators = | ||
| − | * Georgia Tech: Delphine Nain, Yi Gao, Xavier Le Faucheur, Allen Tannenbaum | + | * Georgia Tech Algorithms: Delphine Nain, Yi Gao, Xavier Le Faucheur, Allen Tannenbaum |
| − | * UNC: Martin Styner | + | * UNC Algorithms: Martin Styner |
| − | * Harvard | + | * Harvard DBP1: James Levitt, Marc Niethammer, Sylvain Bouix, Martha Shenton |
= Publications = | = Publications = | ||
| + | * [http://www.na-mic.org/publications/pages/display?search=MultiscaleShapeAnalysis NA-MIC Publications Database on Multiscale Shape Analysis] | ||
| − | + | [[Category:Shape Analysis]] [[Category:Schizophrenia]] | |
| − | |||
| − | |||
| − | |||
| − | |||
| − | |||
| − | |||
| − | |||
| − | |||
Latest revision as of 00:57, 16 November 2013
Home < Projects:MultiscaleShapeAnalysisBack to NA-MIC Collaborations, Stony Brook University Algorithms, UNC Algorithms, Harvard DBP1
Multiscale Shape Analysis applied to Caudate and Hippocampus
We present a novel method of statistical surface-based morphometry based on the use of non-parametric permutation tests and a spherical wavelet (SWC) shape representation. As an application, we analyze two brain structures, the caudate nucleus and the hippocampus. We show that the results nicely complement the results obtained with shape analysis using a sampled point representation (SPHARM-PDM).
Description
Pre-processing
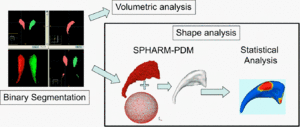
We use the UNC Pipeline to pre-process the shapes. The input is a set of binary segmentation of a single brain structure. We use the following steps from the pipeline:
- Morphological operations: fills any interior holes and applies a minimal smoothing operation
- Surface conversion: converts the processed binary segmentations to surface meshes
- Spherical Parameterization: computes a spherical parameterization for the surface meshes using a area-preserving, distortion minimizing spherical mapping
- Alignment: computes a spherical harmonic (SPARM) description of the parameterized surface meshes and aligns the spherical parameterizations using the first order ellipsoid from the spherical harmonic coefficients.
- Retriangulation: samples the parameterized and aligned surface meshes into triangulated surfaces (SPHARM-PDM) via icosahedron subdivision of the spherical parametrization. These SPHARM-PDM surfaces are all spatially aligned using rigid Procrustes alignment.
Spherical Wavelet Features

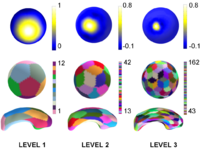
For each triangulated SPHARM-PDM surface (and its corresponding spherical parameterization), a spherical wavelet description is computed. As a result, each shape is represented by a series of 3D spherical wavelet coefficients (SWC). Each 3D coefficient is associated with a basis function that describes a region of the surface. The size of that region depends on the scale of the coefficient. Therefore each 3D coefficient describes the shape at a specific scale and spatial region (See Figure 2).
Statistics
We use the UNC statistical test toolbox that analyzes differences between two groups of surfaces described by a set of features. The group differences are computed locally for every feature using the standard robust Hotelling T^2 two sample metric. Statistical p-values, both raw and corrected for multiple comparisons are given as output. The toolbox outputs a global average P-value for all features, as well as a raw and corrected P-value for each feature. We use the 3D spherical wavelet coefficients as features.
Significance Maps
If a feature (3D spherical wavelet coefficient) is found significant (i.e. its P-value is less than a pre-determined significance level, such as 0.05), we color all points that are in the support of that basis function at that scale with the corresponding P-value. This allows us to visualize both the raw and FDR corrected P-values as significance color maps on the surface of the mean shape of the structure under study. The color at each point is the P-value.
Progress
We conducted statistical shape analysis of two brain structures, the caudate nucleus and hippocampus, using spherical wavelet coefficients (SWC) as features and compare the results obtained to shape analysis using a SPHARM-PDM representation.
Key Investigators
- Georgia Tech Algorithms: Delphine Nain, Yi Gao, Xavier Le Faucheur, Allen Tannenbaum
- UNC Algorithms: Martin Styner
- Harvard DBP1: James Levitt, Marc Niethammer, Sylvain Bouix, Martha Shenton
