Difference between revisions of "2009 Winter Project Week Tumor Microenvironment"
| (11 intermediate revisions by the same user not shown) | |||
| Line 1: | Line 1: | ||
{| | {| | ||
| − | |[[Image:NAMIC-SLC.jpg|thumb|320px|Return to [[ | + | |[[Image:NAMIC-SLC.jpg|thumb|320px|Return to [[2009_Winter_Project_Week]] ]] |
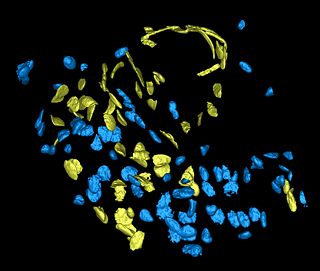
| − | |[[Image:Tme_snapshot2.jpg|thumb|320px|]] | + | |[[Image:Tme_snapshot2.jpg|thumb|320px|Fig 1. Surface rendering of cell nuclei in tissue section of a mouse mammary gland. The dataset was acquired using a Zeiss 510 Meta at 0.14um in-plane and 0.33um between-plane resolution. Endothelial cell nuclei (yellow) were identified using an antibody stain (CD-31). Other cells are marked in blue. ]] |
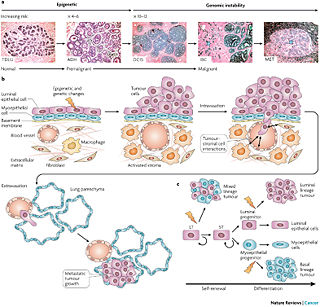
| − | |[[Image:snap3.jpg|thumb|320px|]] | + | |[[Image:snap3.jpg|thumb|320px|[http://www.nature.com/nrc/journal/v7/n9/fig_tab/nrc2193_F1.html#figure-title Fig 2.]]] |
|} | |} | ||
| Line 10: | Line 10: | ||
===Key Investigators=== | ===Key Investigators=== | ||
| − | * The Ohio State University: Shantanu Singh, Raghu Machiraju | + | * The Ohio State University: Shantanu Singh, Raghu Machiraju, Gustavo Leone, Michael Ostrowksi |
* GE Global Research: Jens Rittscher | * GE Global Research: Jens Rittscher | ||
* BWH: Michael Halle, Steve Pieper, Wendy Plesniak | * BWH: Michael Halle, Steve Pieper, Wendy Plesniak | ||
| Line 21: | Line 21: | ||
<h1>Objective</h1> | <h1>Objective</h1> | ||
| − | To implement a microscopy image analysis pipeline in Slicer3, specifically tailored for characterizing the tumor microenvironment as observed in the murine breast tumors. | + | To implement a microscopy image analysis pipeline in Slicer3, specifically tailored for characterizing the tumor microenvironment as observed in the murine breast tumors. The goal will be to validate the theories shown as schematic from [Vargo-Gogola 2007] (rightmost image). |
| − | |||
</div> | </div> | ||
| Line 30: | Line 29: | ||
Integrate existing segmentation, validation and labeling pipelines into the Slicer3 framework. | Integrate existing segmentation, validation and labeling pipelines into the Slicer3 framework. | ||
| − | Begin with level set methods of Mosaliganti | + | Begin with level set methods of [Mosaliganti 2008] . Then the tessellation based method of the same authors, time permitting. Explore what can be obtained with EMSegement of Slicer3. Compare and contrast all sets of results. |
| − | Explore what can be obtained with EMSegement of Slicer3. Compare and contrast all sets of results. | + | Also, explore labeling capabilities of Slicer3. |
| − | Also, explore | ||
</div> | </div> | ||
| Line 40: | Line 38: | ||
<h1>Progress</h1> | <h1>Progress</h1> | ||
| − | + | We wanted to investigate the use of Slicer3 for building a microscopy pipeline and integrate some of the modules of our existing pipeline into Slicer. To start off we used the execution model to load our segmentation algorithm through slicer and started working on building a loadable module for slicer. | |
| + | |||
| + | We got Grid Wizard (Marco) running and set up for our pipeline (need to resolve resource manager issue) | ||
| + | We had discussions (Wendy/Curtis) on annotation capabilities of Slicer3 that will be useful for the tumor microscopy datasets | ||
</div> | </div> | ||
| Line 50: | Line 51: | ||
===References=== | ===References=== | ||
| − | * | + | * T. Vargo-Gogolal, J. M. Rosen, "Modelling breast cancer: one size does not fit all," Nature Reviews Cancer 7, 659-672, September 2007. |
| + | * Mosaliganti,L. Cooper, R. Sharp, R. Machiraju, G. Leone, K. Huang, J. Saltz, "Reconstruction of Cellular Biological Structures from Optical Microscopy Data," Visualization and Computer Graphics, IEEE Transactions on , vol.14, no.4, pp.863-876, July-Aug. 2008 | ||
Latest revision as of 17:36, 9 January 2009
Home < 2009 Winter Project Week Tumor Microenvironment Return to 2009_Winter_Project_Week |
 Fig 1. Surface rendering of cell nuclei in tissue section of a mouse mammary gland. The dataset was acquired using a Zeiss 510 Meta at 0.14um in-plane and 0.33um between-plane resolution. Endothelial cell nuclei (yellow) were identified using an antibody stain (CD-31). Other cells are marked in blue. |
Key Investigators
- The Ohio State University: Shantanu Singh, Raghu Machiraju, Gustavo Leone, Michael Ostrowksi
- GE Global Research: Jens Rittscher
- BWH: Michael Halle, Steve Pieper, Wendy Plesniak
Objective
To implement a microscopy image analysis pipeline in Slicer3, specifically tailored for characterizing the tumor microenvironment as observed in the murine breast tumors. The goal will be to validate the theories shown as schematic from [Vargo-Gogola 2007] (rightmost image).
Approach, Plan
Integrate existing segmentation, validation and labeling pipelines into the Slicer3 framework. Begin with level set methods of [Mosaliganti 2008] . Then the tessellation based method of the same authors, time permitting. Explore what can be obtained with EMSegement of Slicer3. Compare and contrast all sets of results. Also, explore labeling capabilities of Slicer3.
Progress
We wanted to investigate the use of Slicer3 for building a microscopy pipeline and integrate some of the modules of our existing pipeline into Slicer. To start off we used the execution model to load our segmentation algorithm through slicer and started working on building a loadable module for slicer.
We got Grid Wizard (Marco) running and set up for our pipeline (need to resolve resource manager issue)
We had discussions (Wendy/Curtis) on annotation capabilities of Slicer3 that will be useful for the tumor microscopy datasets
References
- T. Vargo-Gogolal, J. M. Rosen, "Modelling breast cancer: one size does not fit all," Nature Reviews Cancer 7, 659-672, September 2007.
- Mosaliganti,L. Cooper, R. Sharp, R. Machiraju, G. Leone, K. Huang, J. Saltz, "Reconstruction of Cellular Biological Structures from Optical Microscopy Data," Visualization and Computer Graphics, IEEE Transactions on , vol.14, no.4, pp.863-876, July-Aug. 2008
