Difference between revisions of "Projects:CardiacAblation"
| (15 intermediate revisions by 2 users not shown) | |||
| Line 3: | Line 3: | ||
= Left atrium segmentation = | = Left atrium segmentation = | ||
| − | The high anatomical variability of the | + | Automatic segmentation of the heart’s left atrium offers great benefits for planning and outcome evaluation of atrial ablation procedures. The high anatomical variability of the left atrium makes its segmentation a particularly difficult problem. Specifically, the shape of the left atrium cavity, as well as the number and locations of the pulmonary veins connecting to it, vary substantially across subjects. We propose and demonstrate a robust atlas-based method for automatic segmentation of the left atrium in contrast-enhanced magnetic resonance angiography (MRA) images. |
== Description == | == Description == | ||
| − | We perform the segmentation via a label fusion algorithm [1] that uses a training set of MRA images of different patients with corresponding manual segmentations. We first align the training images to the test subject image to be segmented and apply the resulting deformations to the corresponding manual segmentation label maps to yield a set of left atrium segmentations in the coordinate space of the test subject. These form a non-parametric subject-specific statistical atlas. We then use a weighted voting algorithm to assign every voxel to the left atrium or to the background. The weighted label fusion scheme assigns higher weights to voxels in training segmentations that are located deeper within the structure of interest and that have similar intensities in training and test images. We also handle varying intensity distributions between images by incorporating iterative intensity equalization in a variant of the demons registration algorithm [2] used for the registration of the training images to the novel test image. | + | We perform the segmentation via a label fusion algorithm [1] that uses a training set of MRA images of different patients with corresponding manual segmentations. We first align the training images to the test subject image to be segmented and apply the resulting deformations to the corresponding manual segmentation label maps to yield a set of left atrium segmentations in the coordinate space of the test subject. These form a non-parametric subject-specific statistical atlas. We then use a weighted voting algorithm to assign every voxel to the left atrium or to the background. The weighted label fusion scheme assigns higher weights to voxels in training segmentations that are located deeper within the structure of interest and that have similar intensities in training and test images. We also handle varying intensity distributions between images by incorporating iterative intensity equalization in a variant of the demons registration algorithm [2] used for the registration of the training images to the novel test image. |
| + | We also applied our new spectral label fusion algorithm for the segmentation of the cardiac data, with the description of the method and the results presented at | ||
| + | [http://www.na-mic.org/Wiki/index.php/Projects:NonparametricSegmentation Nonparametric Segmentation]. | ||
== Results == | == Results == | ||
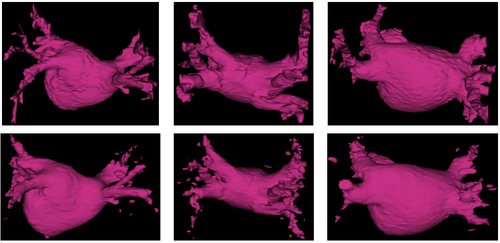
| − | We show in Figure 1 below a qualitative comparison between manual left atrium segmentations and automatic segmentations produced by our approach. | + | We show in Figure 1 below a qualitative comparison between expert manual left atrium segmentations and automatic segmentations produced by our approach. |
[[File:Mdepa_MRA_seg_3D_comparison.png|500px|thumb|center|Figure 1: Qualitative evaluation of left atrium segmentations in three different subjects. First row shows expert manual segmentations. The corresponding automatic segmentations produced by our method are in the second row.]] | [[File:Mdepa_MRA_seg_3D_comparison.png|500px|thumb|center|Figure 1: Qualitative evaluation of left atrium segmentations in three different subjects. First row shows expert manual segmentations. The corresponding automatic segmentations produced by our method are in the second row.]] | ||
| Line 27: | Line 29: | ||
== Conclusions == | == Conclusions == | ||
| − | Experimental results illustrate the capacity of our method to handle high anatomical variability, yielding accurate segmentation and detecting all | + | Experimental results illustrate the capacity of our method to handle high anatomical variability, yielding accurate segmentation and detecting all pulmonary veins in all subjects. By explicitly modeling the anatomical variability represented in the label maps and the corresponding training images, the proposed method outperforms traditional atlas-based segmentation algorithms and a simple label fusion benchmark. |
= Cardiac ablation scar visualization = | = Cardiac ablation scar visualization = | ||
| Line 33: | Line 35: | ||
Atrial fibrillation is one of the most common heart conditions and can have very serious consequences such as stroke and heart failure. A technique called catheter radio-frequency (RF) ablation has recently emerged as a treatment. It involves burning the cardiac tissue that is responsible for the fibrillation. Even though this technique has been shown to work fairly well on atrial fibrillation patients, repeat procedures are often needed to fully correct the condition because surgeons lack the necessary tools to quickly evaluate the success of the procedure. | Atrial fibrillation is one of the most common heart conditions and can have very serious consequences such as stroke and heart failure. A technique called catheter radio-frequency (RF) ablation has recently emerged as a treatment. It involves burning the cardiac tissue that is responsible for the fibrillation. Even though this technique has been shown to work fairly well on atrial fibrillation patients, repeat procedures are often needed to fully correct the condition because surgeons lack the necessary tools to quickly evaluate the success of the procedure. | ||
| − | We propose a method to automatically visualize the scar created by RF ablation in delayed enhancement MR images acquired after the procedure. This will provide surgeons with a | + | We propose a method to automatically visualize the scar created by RF ablation in delayed enhancement MR images acquired after the procedure. This will provide surgeons with a way to evaluate the outcome of cardiac ablation procedures. |
== Description == | == Description == | ||
| Line 44: | Line 46: | ||
== Results == | == Results == | ||
| − | After obtaining the segmentation of the left atrium in the DE-MRI image, we produce a visualization of the ablation scar by simply projecting the DE-MRI data onto the left atrium surface. We restrict the projection to only use image voxels within | + | After obtaining the segmentation of the left atrium in the DE-MRI image, we produce a visualization of the ablation scar by simply projecting the DE-MRI data onto the left atrium surface. We restrict the projection to only use image voxels within an empirically determined distance of 7mm of each side of the left atrium surface. Figure 4 below illustrates the maximum intensity projection results for one subject. In addition, we automatically threshold these projection values by computing the 75th percentile and show the resulting visualization as well. For comparison, we also project the expert manual scar segmentation onto the same left atrium surface. |
| − | [[File:Mdepa_scar_visualization| | + | [[File:Mdepa_scar_visualization.png|400px|thumb|center|Figure 4: Comparison of projections of DE-MRI data and manual scar segmentation onto left atrium surface. Circled area indicates acquisition artifact that causes non-scar tissue to be appear enhanced in the DE-MRI image.]] |
| + | |||
| + | We confirm visually that the thresholded projection values correlate well with the manual scar segmentations. Nevertheless, there is one area, which we circled in the figure, where these two differ considerably. This discrepancy is due to an imaging artifact caused by the acquisition protocol and is likely to cause false positives in any intensity-based algorithm. | ||
== Conclusions == | == Conclusions == | ||
Latest revision as of 20:28, 28 November 2012
Home < Projects:CardiacAblationBack to NA-MIC Collaborations, MIT Algorithms,
Left atrium segmentation
Automatic segmentation of the heart’s left atrium offers great benefits for planning and outcome evaluation of atrial ablation procedures. The high anatomical variability of the left atrium makes its segmentation a particularly difficult problem. Specifically, the shape of the left atrium cavity, as well as the number and locations of the pulmonary veins connecting to it, vary substantially across subjects. We propose and demonstrate a robust atlas-based method for automatic segmentation of the left atrium in contrast-enhanced magnetic resonance angiography (MRA) images.
Description
We perform the segmentation via a label fusion algorithm [1] that uses a training set of MRA images of different patients with corresponding manual segmentations. We first align the training images to the test subject image to be segmented and apply the resulting deformations to the corresponding manual segmentation label maps to yield a set of left atrium segmentations in the coordinate space of the test subject. These form a non-parametric subject-specific statistical atlas. We then use a weighted voting algorithm to assign every voxel to the left atrium or to the background. The weighted label fusion scheme assigns higher weights to voxels in training segmentations that are located deeper within the structure of interest and that have similar intensities in training and test images. We also handle varying intensity distributions between images by incorporating iterative intensity equalization in a variant of the demons registration algorithm [2] used for the registration of the training images to the novel test image. We also applied our new spectral label fusion algorithm for the segmentation of the cardiac data, with the description of the method and the results presented at Nonparametric Segmentation.
Results
We show in Figure 1 below a qualitative comparison between expert manual left atrium segmentations and automatic segmentations produced by our approach.
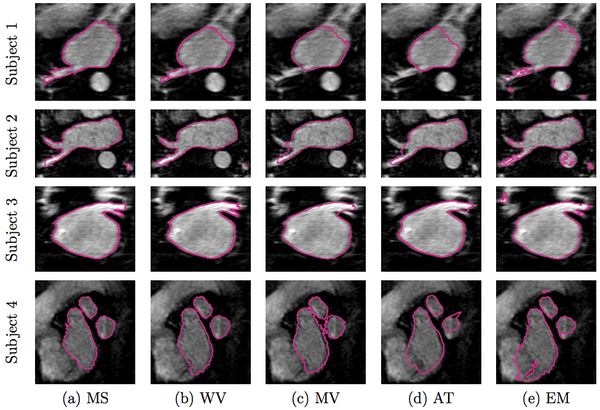
We compare our method of weighed voting (WV) label fusion to three alternative automatic atlas-based approaches: majority voting (MV) label fusion, parametric atlas thresholding (AT) and atlas-based EM-segmentation (EM). The majority voting label fusion is similar to weighted voting, except it assigns each voxel to the label that occurs most frequently in the registered training set at that voxel. We also construct a parametric atlas that summarizes all 16 subjects in a single template image and a probabilistic label map by performing groupwise registration to an average space. After registering this new atlas to the test subject, we segment the left atrium using two different approaches. In atlas thresholding, we simply threshold the warped probabilistic label map at 0.5 to obtain the segmentation. This baseline method is analogous to majority voting in the parametric atlas setting. We also use the parametric atlas as a spatial prior in a traditional model-based EM-segmentation. Note that this construction favors the baseline algorithms as it includes the test image in the registration of all subjects into the common coordinate frame.
In Figure 2 below, we show example segmentations comparing the automatic segmentations produced by these methods and expert manual segmentations.
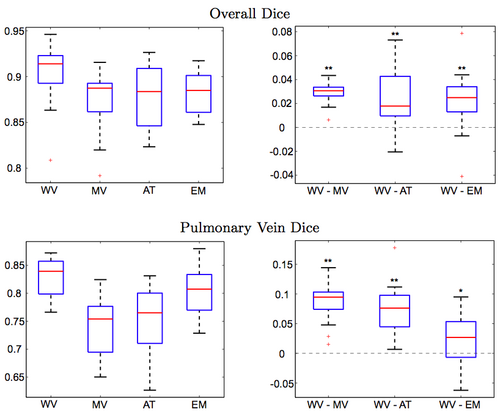
Figure 3 reports the segmentation accuracy for each method, as measured by the volume overlap Dice scores. We also report the differences in segmentation accuracy between our method and the benchmark algorithms. To compute the difference between two methods, we subtract the Dice score of the second method from the score of the first for each subject. Our approach clearly outperforms other algorithms (WV vs. MV: p < 10−9, WV vs. AT: p < 0.002, WV vs. EM: p < 0.003; single-sided paired t-test). To focus the evaluation on the critical part of the structure, we manually isolate the pulmonary veins in each of the manual and automatic segmentations, and compare the Dice scores for these limited label maps. Again, we observe consistent improvements offered by our approach (WV vs. MV: p < 10−7, WV vs. AT: p < 10−7, WV vs. EM: p < 0.03; single-sided paired t-test). Since atlas-based EM-segmentation is an intensity based method, it performs relatively well in segmenting pulmonary veins, but suffers from numerous false positives in other areas, which lower its overall Dice scores.

Conclusions
Experimental results illustrate the capacity of our method to handle high anatomical variability, yielding accurate segmentation and detecting all pulmonary veins in all subjects. By explicitly modeling the anatomical variability represented in the label maps and the corresponding training images, the proposed method outperforms traditional atlas-based segmentation algorithms and a simple label fusion benchmark.
Cardiac ablation scar visualization
Atrial fibrillation is one of the most common heart conditions and can have very serious consequences such as stroke and heart failure. A technique called catheter radio-frequency (RF) ablation has recently emerged as a treatment. It involves burning the cardiac tissue that is responsible for the fibrillation. Even though this technique has been shown to work fairly well on atrial fibrillation patients, repeat procedures are often needed to fully correct the condition because surgeons lack the necessary tools to quickly evaluate the success of the procedure.
We propose a method to automatically visualize the scar created by RF ablation in delayed enhancement MR images acquired after the procedure. This will provide surgeons with a way to evaluate the outcome of cardiac ablation procedures.
Description
The visualization of cardiac scars resulting from ablation procedures in delayed enhancement magnetic resonance images (DE-MRI) is a very challenging problem because of intersubject anatomical variability of the left atrium body and the pulmonary veins, the variation in the shape and location of the scars and tissue that appears enhanced in DE-MRI images even though it is not ablation scar. In addition, visualization is also challenging because even the most advanced acquisition techniques yield DE-MRI images with relatively poor contrast.
With all of these difficulties, performing this segmentation without exploiting some prior knowledge or significant feedback from the user is extremely challenging. Most previous attempts to segment scar in DE-MRI images relied heavily on input from the user. In contrast, we avoid this by automatically segmenting the left atrium in the DE-MRI images of the patients. The atrium segmentation provides us with prior information about the location and shape of the left atrium, which in turn helps counter some of the challenges that were previously solved by requiring significant amounts of user interaction. We obtain this segmentation by first segmenting the left atrium in the MRA image of the patient’s heart using the method presented above. We then align the MRA image to the corresponding DE-MRI image of the same subject. With these two images aligned, we transfer the left atrium segmentation from the MRA to the DE-MRI image by applying the transformation computed in the registration.
Results
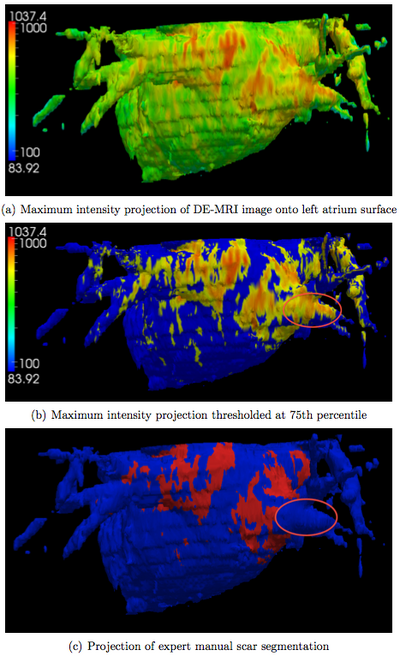
After obtaining the segmentation of the left atrium in the DE-MRI image, we produce a visualization of the ablation scar by simply projecting the DE-MRI data onto the left atrium surface. We restrict the projection to only use image voxels within an empirically determined distance of 7mm of each side of the left atrium surface. Figure 4 below illustrates the maximum intensity projection results for one subject. In addition, we automatically threshold these projection values by computing the 75th percentile and show the resulting visualization as well. For comparison, we also project the expert manual scar segmentation onto the same left atrium surface.
We confirm visually that the thresholded projection values correlate well with the manual scar segmentations. Nevertheless, there is one area, which we circled in the figure, where these two differ considerably. This discrepancy is due to an imaging artifact caused by the acquisition protocol and is likely to cause false positives in any intensity-based algorithm.
Conclusions
We visualize the ablation scars by performing a maximum intensity projection of the DE-MRI image onto the automatically generated surface of the left atrium. The visualization is further improved by thresholding the projection. We showed visually that both visualizations correlate well with the expert manual segmentation of the ablation scars.
Literature
[1] Nonparametric Mixture Models for Supervised Image Parcellation, M.R. Sabuncu, B.T.T. Yeo, K. Van Leemput, B. Fischl, and P. Golland. PMMIA Workshop at MICCAI 2009.
[2] Diffeomorphic demons: Efficient non-parametric image registration. Vercauteren, T., Pennec, X., Perchant, A., Ayache, N. NeuroImage 45(1), S61–S72 (2009)
Key Investigators
- MIT: Michal Depa and Polina Golland
- BWH: Ehud Schmidt and Ron Kikinis
Publications
NA-MIC Publications Database on Segmentation and Visualization for Cardiac Ablation Procedures


