Difference between revisions of "Projects:Utah2ShapeRegression"
m (Fix MediaWiki formatting issue discovered while converting to GitHub Flavored Markdown using pandoc (via https://github.com/outofcontrol/mediawiki-to-gfm)) Tag: 2017 source edit |
|||
| (38 intermediate revisions by 2 users not shown) | |||
| Line 2: | Line 2: | ||
__NOTOC__ | __NOTOC__ | ||
| − | = Smooth Growth Trajectories from Time Series Shape Data = | + | = Ongoing Work (Updated 8/16/12) = |
| + | |||
| + | == Smooth Growth Trajectories from Time Series Shape Data == | ||
Segmentation of multi-time point image data of individual subjects results in serial shape data of structures of interest. Clinical research is interested in the spatiotemporal analysis of shape changes, which potentially leads to improved understanding of the rate of change, locality and growth trajectory of structures of interest. | Segmentation of multi-time point image data of individual subjects results in serial shape data of structures of interest. Clinical research is interested in the spatiotemporal analysis of shape changes, which potentially leads to improved understanding of the rate of change, locality and growth trajectory of structures of interest. | ||
| − | = Description = | + | == Description == |
| − | Longitudinal shape analysis often relies on the estimation of a realistic continuous growth scenario from data sparsely distributed in time. In this project, we develop a new type of growth model parameterized by acceleration, whereas standard methods usually control the velocity [1,2]. From this parameterization, we gain one order of differentiability and guarantee that shape evolution is smooth in both space and time. This mimics the behavior of biological tissue as a mechanical system driven by external forces. The growth trajectories are estimated as continuous flows of deformations, which are twice differentiable. The shape regression is based on a correspondence-free technique using ''currents'' [2,3], which calculates diffeomorphic flows between set | + | Longitudinal shape analysis often relies on the estimation of a realistic continuous growth scenario from data sparsely distributed in time. In this project, we develop a new type of growth model parameterized by acceleration, whereas standard methods usually control the velocity [1,2]. From this parameterization, we gain one order of differentiability and guarantee that shape evolution is smooth in both space and time. This mimics the behavior of biological tissue as a mechanical system driven by external forces. The growth trajectories are estimated as continuous flows of deformations, which are twice differentiable. The shape regression is based on a correspondence-free technique using ''currents'' [2,3], which calculates diffeomorphic flows between set of shapes represented as surface data. |
| + | [[File:Shape_regression_illustration.png|700px|center|thumb|Shape regression involves estimating a continuous evolution from a set of discrete shapes.]] | ||
| + | |||
| + | == Results == | ||
| + | |||
| + | To evaluate our method, we use longitudinal image data from a child that has been scanned 16 times between four and eight years of age. The MRI data is first rigidly aligned to establish a common reference frame. The intracranial volume and lateral ventricles are segmented from each image using an EM based tissue classification algorithm and a level-set based active contour segmentation tool. | ||
| + | |||
| + | We estimate the evolution of the intracranial surface using a regression model based on the piecewise geodesic flow of diffeomorphisms as in [3]. The standard deviation of the Gaussian kernel controlling deformation is set to 50mm, roughly 30% of the diameter of the baseline intracranial surface. For the scale of currents we use 20mm, with a regularity weight of 0.1. Finally, time is discretized in increments of$0.0425 years. We also produce a growth trajectory using our proposed method with the same parameter settings as above except we weight regularity by 0.01 (the two weighted terms cannot be compared since they have different `physical' dimension). The parameters were tuned empirically to produce regressions of comparable quality with both methods. | ||
| + | |||
| + | Shape evolution is considerably smoother using our proposed regression model as compared to the piecewise geodesic model. This is particularly evident in the trajectories of the shape points across time, a subset of which are shown below. It is an important distinction that the trajectories estimated by our method are ''not'' a smoothing of the piecewise geodesic method. Rather, the trajectories are the result of fundamentally different assumptions on the underlying model which results in a more realistic estimation of growth. | ||
| + | |||
| + | [[File:Long_pg_vs_accel.png|600px|center|thumb|Shape evolution from baseline (solid) to final configuration (transparent) | ||
| + | using a model based on piecewise geodesics (top left) and our method (bottom left) with point trajectories for selected particles displayed as black lines. | ||
| + | On the right, the path of a point on the forebrain is decomposed into coordinates. Growth is estimated using 15 target shapes, highlighting the speed discontinuities present in the piecewise | ||
| + | geodesic evolution.]] | ||
| + | |||
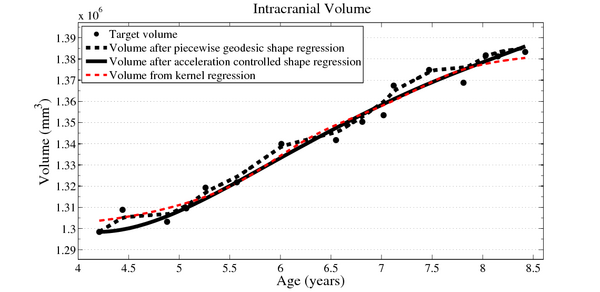
| + | Next, we investigate the application of our model to the study of measurements derived from shape. Here we obtain a continuous non-linear model of volume, shown in the figure below. The results are consistent with a 1D regression model, such as kernel regression, applied to the sparse volume measurements. However, we have focused our modeling efforts on capturing the evolution of shape, with continuous volume measurements resulting naturally from the estimated growth. In addition, the piecewise geodesic method appears to be overfitting, producing unrealistic volume measurements, further suggesting that our method is more robust in the presence of noisy data. | ||
| + | |||
| + | [[File:Long_accel_volume_w_kernel_reg.png|600px|center|thumb|Volume measurements derived from our growth model are consistent with a kernel regression performed on the sparse volume measurements. Our model describes the continuous evolution of ''shape'' and volume is measured after regression.]] | ||
| + | |||
| + | We also consider the evolution of the lateral ventricles, which exhibit considerably more complexity than the intracranial surface. The horns of the segmented lateral ventricles are as thin as a few millimeters, making regression particularly challenging. As with the intracranial volume, ventricle growth is estimated using a piecewise geodesic model and our acceleration based model. The scale of deformation is set at 6mm, the scale of currents to 2mm, and regularity is weighted by 0.1 and 0.01, respectively. | ||
| + | |||
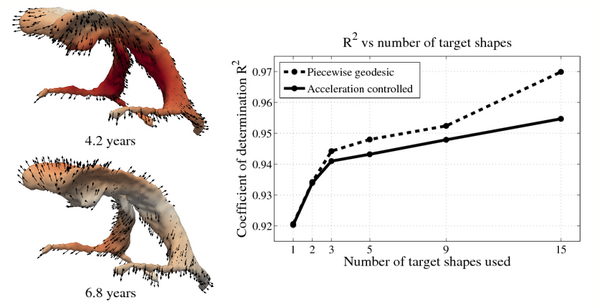
| + | The impact of missing data is examined by performing leave-several-out experiments, the results of which are summarized in the figure below. In all experiments, selected target shapes were chosen as uniformly across time as possible. Our method demonstrates robustness with respect to the number of target shapes, with only minimal increase in the coefficient of determination R^2 when using more than 3 targets. This suggests that our method captures the underlying growth with limited data, as additional target data does not greatly alter the estimation. In contrast, piecewise geodesic regression is more influenced by additional target data and is therefore likely to overfit. | ||
| + | |||
| + | [[File:Leave_several_out_summary.png|600px|center|thumb|'''Left:''' Snapshots from a continuous shape evolution of lateral ventricles estimated by our regression model. Acceleration vectors are displayed on the surface, with color denoting magnitude. '''Right:''' The impact of the number of target shapes on R^2.]] | ||
| + | |||
| + | == Application to Autism Research (former DBP partner UNC Psychiatry) == | ||
| + | |||
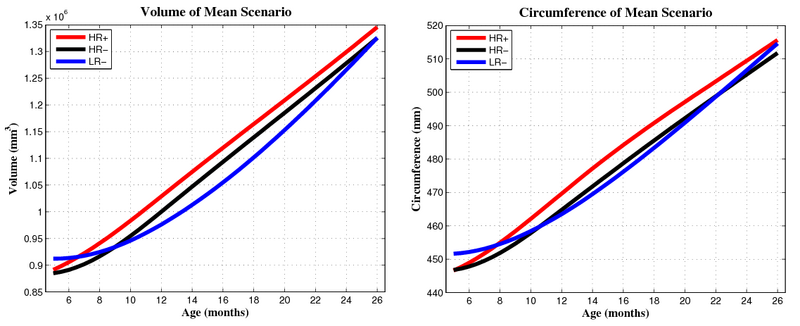
| + | Preliminary results seem to indicate a different pattern of growth between the HR+ group (high risk diagnosed with Autism or ASD) and the HR- (high risk not diagnosed with Autism) and LR- (controls not diagnosed with Autism) groups. We observe rapid outward growth of the forebrain in HR+, as compared to more isotropic growth in HR- and LR-. Currently we are working on developing a complete statistical framework for the analysis of shape trajectories as well as the evolution of scalar measurements derived from shape (such as volume or circumference). | ||
| + | |||
| + | [[File:Hrp_hrm_lrm_mean_scenario_small_first_frame.png|800px|center|thumb|Mean growth scenarios for HR+ (high risk diagnosed with Autism or ASD), HR- (high risk not diagnosed with Autism), and LR- (controls not diagnosed with Autism). [[Media:Hrp_hrm_lrm_mean_scenario_small.gif|Click here for an animation.]] ]] | ||
| + | |||
| + | [[File:Mean_scenarios_volume_and_circumference.png|800px|center|thumb|Volume and circumference measured from mean growth scenarios.]] | ||
| + | |||
| + | == Application to Huntington's Disease (DBP partner Iowa) == | ||
| + | |||
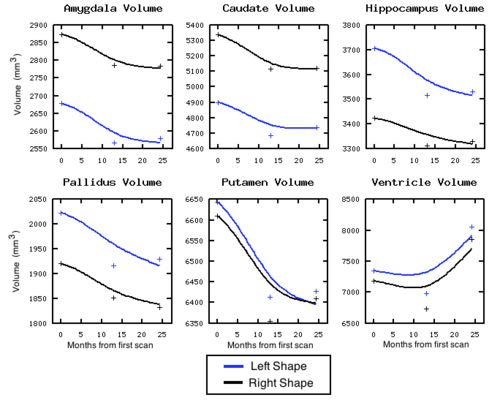
| + | We are investigating the application of our shape regression framework to the study of Huntington's disease. Here we estimate the evolution of a shape complex consisting of 6 sets of sub-cortical structures (12 total shapes). We observe a volume loss over time in all the structures except the ventricles, which are expected to grow if the other structures shrink (they are fluid). These preliminary results on a single subject are promising, and we are beginning to experiment on many additional subjects. | ||
| + | |||
| + | [[Image:Sub_cort_evo_snapshot.png|thumb|800px|center| Snapshots of the evolution of several sub-cortical structures. Color denotes magnitude of velocity. [[Media:Sub_cort_evolution_sigmaV_10_sigmaW_10_gammaR_0p1.gif|Click here for an animation.]] ]] | ||
| + | |||
| + | [[Image:Volume_sigmaV_10_sigmaW_10_gammaR_0p1.png|thumb|500px|center| Volume measured after shape regression. Plus signs denote target volume.]] | ||
| + | |||
| + | = Software Tools = | ||
| + | |||
| + | At the NAMIC summer project week 2012, we mt with current and prospective users to get their input on what they expect from the software. | ||
| + | |||
| + | We considered the input format, which presents a trade off between ease of use and robustness. The easiest input format from a user's point of view would be segmentation label images. However, this choice leads to issues with mesh extraction, simplification, smoothing, etc. We have concluded that the most realistic input to the system should be aligned, simplified meshes. It is up to the user to provide aligned meshes of adequate quality and reasonable complexity. However, the users have requested documentation for the preprocessing steps, with specific tools provided for each step. | ||
| + | |||
| + | We considered the output format as well. We have decided on outputting shapes and corresponding vector fields in ascii VTK format. | ||
| + | |||
| + | A page for downloading the software and documentation for building/using it can be found http://www.cs.utah.edu/~jfishbau/shapereg.html. | ||
| + | |||
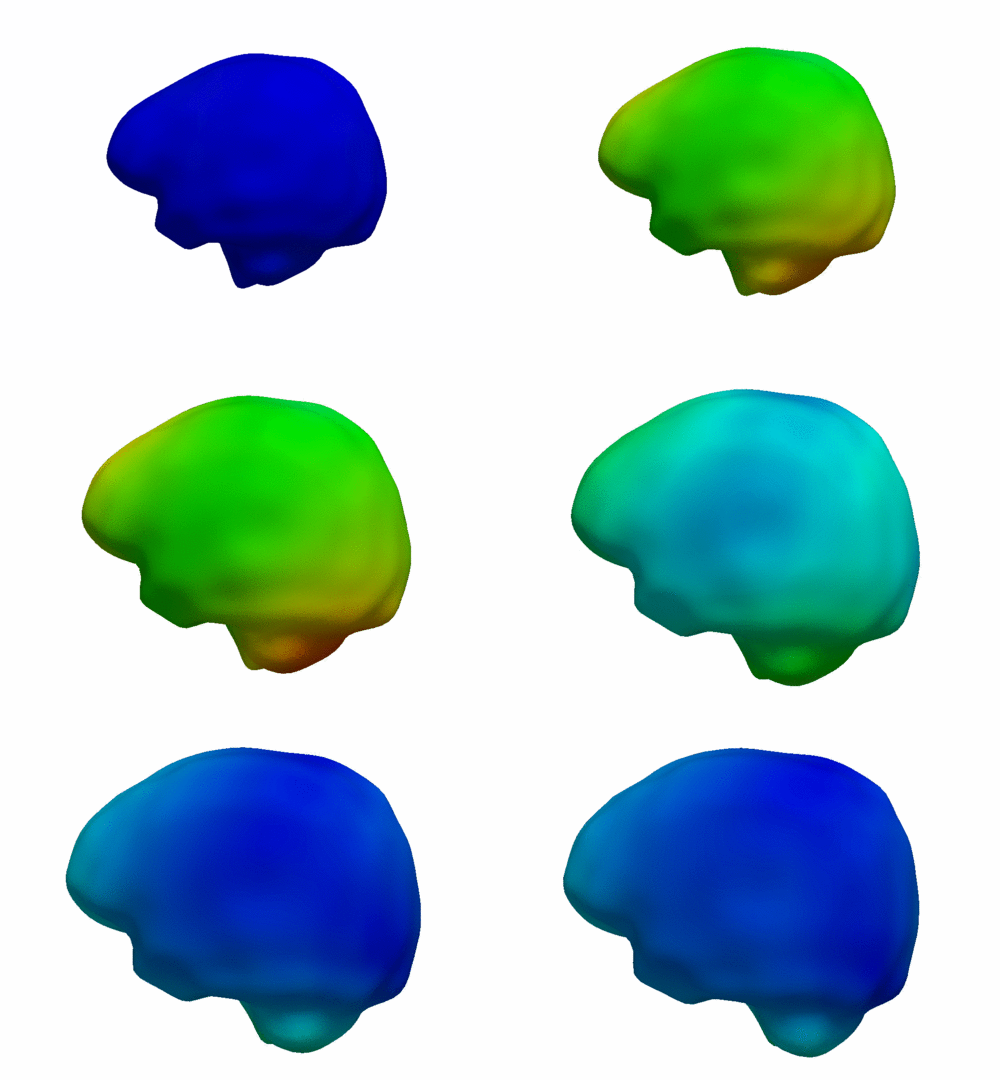
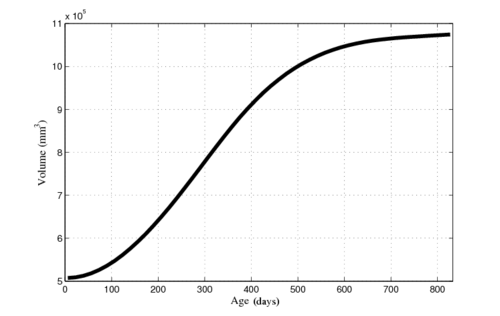
| + | The software was used successfully by Beatriz Paniagua at UNC to estimate a healthy atlas from over 400 shapes. The results can be seen below. | ||
| + | |||
| + | {| class="wikitable" style="margin: 1em auto 1em auto;" | ||
| + | |- | ||
| + | | [[Image:cranio_all_exp_small.gif|thumb|500px|center|Atlas of healthy evolution from birth to ~2 years, estimated from over 400 surfaces. Velocity is displayed on the surface. ]] || [[Image:volume.png|thumb|500px|center|Volume measured continuously after regression.]] | ||
| + | |- | ||
| + | |} | ||
| + | |||
| + | = Former Work = | ||
| + | |||
In pilot tests on an infant growth study, we demonstrate that volume measurements taken out of our 3D shape regression are compatible with a 1D regression of these measurements. This implies that also other morphometric measurements of interest for clinicians might be smooth and thus model biological change in a realistic way. Leave-several-out experiments demonstrate that the new method better interpolates between data and is therefore more robust to missing observations. This suggests a greater ability to capture the underlying growth of the anatomical structures. | In pilot tests on an infant growth study, we demonstrate that volume measurements taken out of our 3D shape regression are compatible with a 1D regression of these measurements. This implies that also other morphometric measurements of interest for clinicians might be smooth and thus model biological change in a realistic way. Leave-several-out experiments demonstrate that the new method better interpolates between data and is therefore more robust to missing observations. This suggests a greater ability to capture the underlying growth of the anatomical structures. | ||
| − | We plan to apply this method to anatomical shapes of image data on Huntington | + | We plan to apply this method to anatomical shapes of image data on Huntington diseases (HD) provided the IOWA DBP partner. Preliminary studies showed an inflection of change rapid decrease of striatal volume trajectory, and application of this methodology to three time point data might reveal morphological characteristics of such volume loss. |
| − | = Results = | + | == Results == |
| − | Tests of the prototype shape regression software on synthetic and real image data shows smooth shape evolution based on only few discrete time points. This property will be important when comparing shape change trajectories between different subjects, in particular if images/shapes are not taken at the same time. The regression is based on a correspondence-free method that uses the "currents" method for estimation of diffeomorphic registration. | + | Tests of the prototype shape regression software on synthetic and real image data shows smooth shape evolution based on only few discrete time points. This property will be important when comparing shape change trajectories between different subjects, in particular if images/shapes are not taken at the same time. The regression is based on a correspondence-free method that uses the "currents" method for estimation of diffeomorphic registration. This property might be important when shapes with slightly different topology due to segmentation noise and biological change (see e.g. ventricles) are compared. |
| − | The following images show the example of brain ventricles measured at | + | The following images show the example of brain ventricles and intracranial volumes (ICV) measured at 6 month, 1 year and 2 years of age and the resulting smooth shape evolution. |
{| border="0" style="background:transparent;" | {| border="0" style="background:transparent;" | ||
| − | |[[File:VentShape-Regression.PNG|320px|center|thumb|Brain ventricle change | + | |[[File:VentShape-Regression.PNG|320px|center|thumb|Brain ventricle change 6mo/1yr/2yrs.]] |
| − | |[[File: | + | |[[File:Vent-volume.png|300px|center|thumb|Ventricle volumes and surface area at discrete time points]] |
| − | |[[File: | + | |[[File:Vent-volume-regression.png|250px|center|thumb|Ventricle and ICV volumes calculated from shape regression]] |
|- | |- | ||
|} | |} | ||
{| border="0" style="background:transparent;" | {| border="0" style="background:transparent;" | ||
| − | [[File:VentShape-Regression-Movie.gif| | + | | [[File:VentShape-Regression-Movie.gif|700px|thumb|left| Shape regression for individual subject from 6 months to 2 years. [[Media:VentShape-Regression-Movie.gif|Click here for full size.]] ]] |
|- | |- | ||
|} | |} | ||
| − | |||
| − | |||
| − | |||
| − | |||
| − | |||
= Literature = | = Literature = | ||
Latest revision as of 20:44, 11 April 2023
Home < Projects:Utah2ShapeRegressionBack to Utah 2 Algorithms
Ongoing Work (Updated 8/16/12)
Smooth Growth Trajectories from Time Series Shape Data
Segmentation of multi-time point image data of individual subjects results in serial shape data of structures of interest. Clinical research is interested in the spatiotemporal analysis of shape changes, which potentially leads to improved understanding of the rate of change, locality and growth trajectory of structures of interest.
Description
Longitudinal shape analysis often relies on the estimation of a realistic continuous growth scenario from data sparsely distributed in time. In this project, we develop a new type of growth model parameterized by acceleration, whereas standard methods usually control the velocity [1,2]. From this parameterization, we gain one order of differentiability and guarantee that shape evolution is smooth in both space and time. This mimics the behavior of biological tissue as a mechanical system driven by external forces. The growth trajectories are estimated as continuous flows of deformations, which are twice differentiable. The shape regression is based on a correspondence-free technique using currents [2,3], which calculates diffeomorphic flows between set of shapes represented as surface data.
Results
To evaluate our method, we use longitudinal image data from a child that has been scanned 16 times between four and eight years of age. The MRI data is first rigidly aligned to establish a common reference frame. The intracranial volume and lateral ventricles are segmented from each image using an EM based tissue classification algorithm and a level-set based active contour segmentation tool.
We estimate the evolution of the intracranial surface using a regression model based on the piecewise geodesic flow of diffeomorphisms as in [3]. The standard deviation of the Gaussian kernel controlling deformation is set to 50mm, roughly 30% of the diameter of the baseline intracranial surface. For the scale of currents we use 20mm, with a regularity weight of 0.1. Finally, time is discretized in increments of$0.0425 years. We also produce a growth trajectory using our proposed method with the same parameter settings as above except we weight regularity by 0.01 (the two weighted terms cannot be compared since they have different `physical' dimension). The parameters were tuned empirically to produce regressions of comparable quality with both methods.
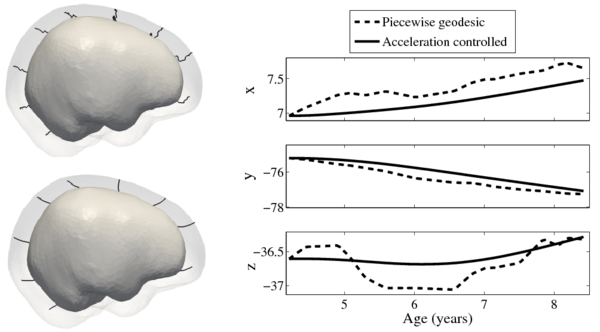
Shape evolution is considerably smoother using our proposed regression model as compared to the piecewise geodesic model. This is particularly evident in the trajectories of the shape points across time, a subset of which are shown below. It is an important distinction that the trajectories estimated by our method are not a smoothing of the piecewise geodesic method. Rather, the trajectories are the result of fundamentally different assumptions on the underlying model which results in a more realistic estimation of growth.
Next, we investigate the application of our model to the study of measurements derived from shape. Here we obtain a continuous non-linear model of volume, shown in the figure below. The results are consistent with a 1D regression model, such as kernel regression, applied to the sparse volume measurements. However, we have focused our modeling efforts on capturing the evolution of shape, with continuous volume measurements resulting naturally from the estimated growth. In addition, the piecewise geodesic method appears to be overfitting, producing unrealistic volume measurements, further suggesting that our method is more robust in the presence of noisy data.
We also consider the evolution of the lateral ventricles, which exhibit considerably more complexity than the intracranial surface. The horns of the segmented lateral ventricles are as thin as a few millimeters, making regression particularly challenging. As with the intracranial volume, ventricle growth is estimated using a piecewise geodesic model and our acceleration based model. The scale of deformation is set at 6mm, the scale of currents to 2mm, and regularity is weighted by 0.1 and 0.01, respectively.
The impact of missing data is examined by performing leave-several-out experiments, the results of which are summarized in the figure below. In all experiments, selected target shapes were chosen as uniformly across time as possible. Our method demonstrates robustness with respect to the number of target shapes, with only minimal increase in the coefficient of determination R^2 when using more than 3 targets. This suggests that our method captures the underlying growth with limited data, as additional target data does not greatly alter the estimation. In contrast, piecewise geodesic regression is more influenced by additional target data and is therefore likely to overfit.
Application to Autism Research (former DBP partner UNC Psychiatry)
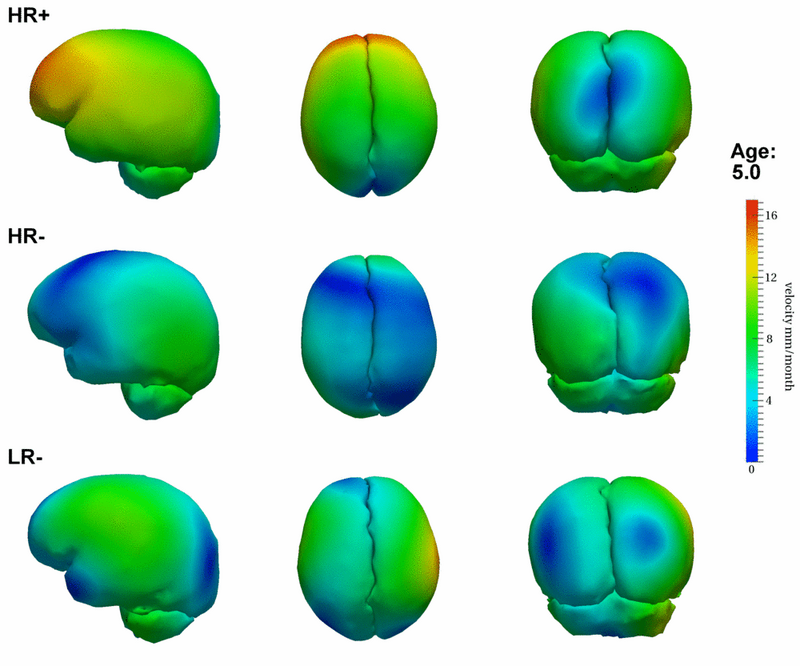
Preliminary results seem to indicate a different pattern of growth between the HR+ group (high risk diagnosed with Autism or ASD) and the HR- (high risk not diagnosed with Autism) and LR- (controls not diagnosed with Autism) groups. We observe rapid outward growth of the forebrain in HR+, as compared to more isotropic growth in HR- and LR-. Currently we are working on developing a complete statistical framework for the analysis of shape trajectories as well as the evolution of scalar measurements derived from shape (such as volume or circumference).
Application to Huntington's Disease (DBP partner Iowa)
We are investigating the application of our shape regression framework to the study of Huntington's disease. Here we estimate the evolution of a shape complex consisting of 6 sets of sub-cortical structures (12 total shapes). We observe a volume loss over time in all the structures except the ventricles, which are expected to grow if the other structures shrink (they are fluid). These preliminary results on a single subject are promising, and we are beginning to experiment on many additional subjects.

Software Tools
At the NAMIC summer project week 2012, we mt with current and prospective users to get their input on what they expect from the software.
We considered the input format, which presents a trade off between ease of use and robustness. The easiest input format from a user's point of view would be segmentation label images. However, this choice leads to issues with mesh extraction, simplification, smoothing, etc. We have concluded that the most realistic input to the system should be aligned, simplified meshes. It is up to the user to provide aligned meshes of adequate quality and reasonable complexity. However, the users have requested documentation for the preprocessing steps, with specific tools provided for each step.
We considered the output format as well. We have decided on outputting shapes and corresponding vector fields in ascii VTK format.
A page for downloading the software and documentation for building/using it can be found http://www.cs.utah.edu/~jfishbau/shapereg.html.
The software was used successfully by Beatriz Paniagua at UNC to estimate a healthy atlas from over 400 shapes. The results can be seen below.
Former Work
In pilot tests on an infant growth study, we demonstrate that volume measurements taken out of our 3D shape regression are compatible with a 1D regression of these measurements. This implies that also other morphometric measurements of interest for clinicians might be smooth and thus model biological change in a realistic way. Leave-several-out experiments demonstrate that the new method better interpolates between data and is therefore more robust to missing observations. This suggests a greater ability to capture the underlying growth of the anatomical structures.
We plan to apply this method to anatomical shapes of image data on Huntington diseases (HD) provided the IOWA DBP partner. Preliminary studies showed an inflection of change rapid decrease of striatal volume trajectory, and application of this methodology to three time point data might reveal morphological characteristics of such volume loss.
Results
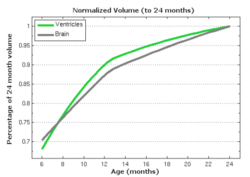
Tests of the prototype shape regression software on synthetic and real image data shows smooth shape evolution based on only few discrete time points. This property will be important when comparing shape change trajectories between different subjects, in particular if images/shapes are not taken at the same time. The regression is based on a correspondence-free method that uses the "currents" method for estimation of diffeomorphic registration. This property might be important when shapes with slightly different topology due to segmentation noise and biological change (see e.g. ventricles) are compared.
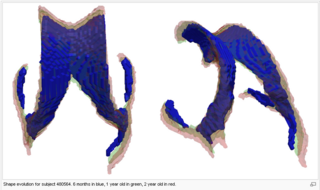
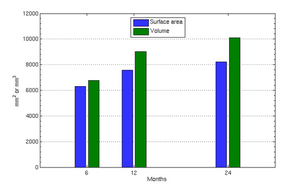
The following images show the example of brain ventricles and intracranial volumes (ICV) measured at 6 month, 1 year and 2 years of age and the resulting smooth shape evolution.
 Shape regression for individual subject from 6 months to 2 years. Click here for full size. |
Literature
[1] Miller, M, I., Trouve, A., Younes, L.: On the metrics and Euler-Lagrange equations of Computational Anatomy. Annual Review of Biomedical Engineering 4 (2002), 375–405
[2] Vaillant, M., Glaunes, J.: Surface matching via currents. In: Proceedings of IPMI. (2005) 381–392
[3] Durrleman, S., Pennec, X., Trouve, A., Gerig, G., Ayache, N.: Spatiotemporal atlas estimation for developmental delay detection in longitudinal datasets. In: Proc. of MICCAI’09, Part I. (2009) 297–304
Key Investigators
- Utah: James Fishbaugh, Stanley Durrleman, Guido Gerig
- IOWA: Hans Johnson

