Difference between revisions of "Algorithm:UNC:DTI"
(Updated tract analysis section with flowchart) |
|||
| (14 intermediate revisions by 2 users not shown) | |||
| Line 1: | Line 1: | ||
= Quantitative Tract Analysis = | = Quantitative Tract Analysis = | ||
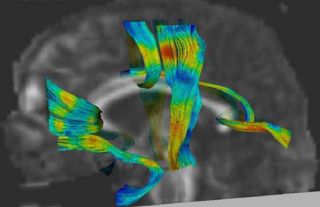
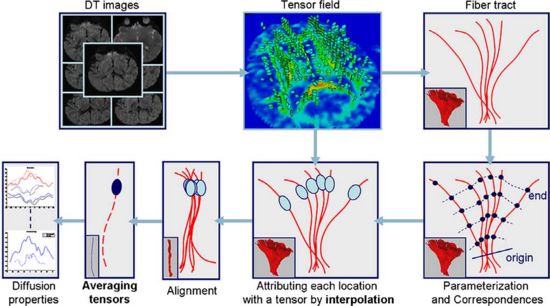
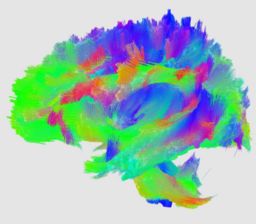
This project proposes a framework for quantitative analysis of DTI data. The framework uses the full tensor information for statistical analysis using the affine-invariant Riemannian metric for defining operations such as interpolation and averaging on tensors. Furtheremore, the results of tractography are used to provide a reference coordinate system the respresents the underlying structure of fiber bundles. The tract modeling framework includes a model both of the geometry of the fiber bundle and of the diffusion properties along the bundle. A new anisotropy measure called geodesic anisotropy (GA) is also included in the framework. | This project proposes a framework for quantitative analysis of DTI data. The framework uses the full tensor information for statistical analysis using the affine-invariant Riemannian metric for defining operations such as interpolation and averaging on tensors. Furtheremore, the results of tractography are used to provide a reference coordinate system the respresents the underlying structure of fiber bundles. The tract modeling framework includes a model both of the geometry of the fiber bundle and of the diffusion properties along the bundle. A new anisotropy measure called geodesic anisotropy (GA) is also included in the framework. | ||
| − | [[image:corouge_dti_statistics.jpg|thumb|320px|Fiber tracts with | + | |
| + | [[Algorithm:UNC:DTI_Tract_Statistics_Workflow | Tract statistics user workflow]] | ||
| + | |||
| + | [[image:corouge_dti_statistics.jpg|thumb|320px|Fiber tracts colored with FA attributes]] | ||
[[image:corouge-tract-analysis-flowchart.jpg|550px]] | [[image:corouge-tract-analysis-flowchart.jpg|550px]] | ||
| + | |||
| + | === Project Week Slides === | ||
| + | [[media:namic-tractanalysis.ppt| 4-block - June 2005]] | ||
= Population Analysis = | = Population Analysis = | ||
| − | Our methodology for population analysis of DT-MRI is based on unbiased non-rigid registration of a population to a common coordinate system. The registration jointly produces an average DTI | + | Our methodology for population analysis of DT-MRI is based on unbiased non-rigid registration of a population to a common coordinate system. The registration jointly produces an average DTI atlas, which is unbiased with respect to the choice of a template image, along with diffeomorphic correspondence between each image. The registration image match metric uses a feature detector for thin fiber structures of white matter, and interpolation and averaging of diffusion tensors use the Riemannian symmetric space framework. The anatomically significant correspondence provides a basis for comparison of tensor features and fiber tract geometry in clinical studies. |
| − | atlas, which is unbiased with respect to the choice of a template image, along with diffeomorphic correspondence between each image. The | ||
| − | registration image match metric uses a feature detector for thin fiber | ||
| − | structures of white matter, and interpolation and averaging of diffusion | ||
| − | tensors use the Riemannian symmetric space framework. The anatomically significant correspondence provides a basis for comparison of tensor | ||
| − | features and fiber tract geometry in clinical studies. | ||
[[Image:goodlett_dti_atlas_flowchart.png]] | [[Image:goodlett_dti_atlas_flowchart.png]] | ||
| − | [[Image:cbg-dtiatlas-tensors.png|thumb|right | + | {| style="float:right; clear:right; margin:0 0 .2em 1em;" |
| − | [[Image:cbg-dtiatlas-tracts.png|thumb|right | + | |- style="vertical-align:top" |
| + | | [[Image:cbg-dtiatlas-tensors.png|thumb|none|<!-- Attempt give both boxes the same height. | ||
| + | --><div style="float:right;clear:right;font-size:inherit;background:inherit;border:none;margin:0;"><!-- | ||
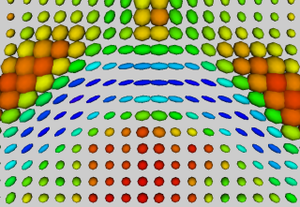
| + | --></div>Tensors in Splenium of averaged DTI atlas]] | ||
| + | | [[Image:cbg-dtiatlas-tracts.png|thumb|none|<!-- Attempt give both boxes the same height. | ||
| + | --><div style="float:right;clear:right;font-size:inherit;background:inherit;border:none;margin:0;"><!-- | ||
| + | --></div>Tractography through Corpus Callosum of averaged DTI atlas]] | ||
| + | |} | ||
| + | |||
Our registration procedure is based on a scalar feature image which is sensitive to sheet like structures. We have observed that the major fiber bundles of interest occur as sheet or tube like manifolds in the FA image of the brain. As a feature image we use the maximum eigenvalue of the hessian of the FA image. Images are initially aligned using an affine registration and then deformed to a common coordinate system using the unbiased atlas-building procedure of Joshi et al. [http://www.ncbi.nlm.nih.gov/entrez/query.fcgi?cmd=Retrieve&db=PubMed&list_uids=15501084&dopt=Citation]. The deformation fields produced by the registration process are applied to the tensors fields using appropriate methods for reorienting and interpolating tensors. The transformed images are averaged in the atlas space to produce a DTI atlas. | Our registration procedure is based on a scalar feature image which is sensitive to sheet like structures. We have observed that the major fiber bundles of interest occur as sheet or tube like manifolds in the FA image of the brain. As a feature image we use the maximum eigenvalue of the hessian of the FA image. Images are initially aligned using an affine registration and then deformed to a common coordinate system using the unbiased atlas-building procedure of Joshi et al. [http://www.ncbi.nlm.nih.gov/entrez/query.fcgi?cmd=Retrieve&db=PubMed&list_uids=15501084&dopt=Citation]. The deformation fields produced by the registration process are applied to the tensors fields using appropriate methods for reorienting and interpolating tensors. The transformed images are averaged in the atlas space to produce a DTI atlas. | ||
An initial test was performed by using the procedure on a set of images of healthy subject at age one year. The results of the tensor averaging are shown on the right. Tractography was also performed on the mean atlas image as shown. | An initial test was performed by using the procedure on a set of images of healthy subject at age one year. The results of the tensor averaging are shown on the right. Tractography was also performed on the mean atlas image as shown. | ||
| + | |||
| + | === Collaboration with [[DBP:Harvard|PNL]] === | ||
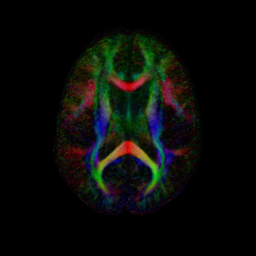
| + | We have begun to apply the DTI atlas building procedure to data provided by the [[DBP:Harvard|PNL]]. A combined set of DTI scans from control and Schizophrenic subjects were aligned using the procedure described above. In the atlas space the SZ and CNTL groups are processed to produce voxel-wise statistics for each group. The figure below shows colored FA and mean diffusivity slices for both the CNTL and SZ group. Preliminary work is now being done on region of interest (ROI) hypothesis testing between the two populations. | ||
| + | |||
| + | {| | ||
| + | |[[Image:goodlett-nccfaaxial039.png|thumb|256px|Color FA of tensors for control group]] | ||
| + | |[[Image:goodlett-ncmdaxial039.png|thumb|256px|Mean Diffusivity of tensors for control group]] | ||
| + | |- | ||
| + | |[[Image:goodlett-szcfaaxial039.png|thumb|256px|Color FA of tensors for SZ group]] | ||
| + | |[[Image:goodlett-szmdaxial039.png|thumb|256px|Mean Diffusivity of tensors for SZ group]] | ||
| + | |} | ||
| + | |||
| + | {| | ||
| + | |[[Image:ncatlasfibers-axial.jpg|thumb|256px|Axial view of fibers tracked in the control atlas]] | ||
| + | |[[Image:ncatlasfibers-coronal.jpg|thumb|256px|Coronal view of fibers tracked in the control atlas]] | ||
| + | |[[Image:ncatlasfibers-sagittal.jpg|thumb|256px|Saggital view of fibers tracked in the control atlas]] | ||
| + | |} | ||
= Noise Statistics = | = Noise Statistics = | ||
Clinical time limitations on the acquisition of diffusion weighted volumes in DTI present several key challenges for quantiative statistics of diffusion tensors and tensor-derived measures. First, the signal to noise ratio (SNR) in each individual diffusion weighted volume is relatively low due to the need for quick acquisition. Secondly, the presence of Rician noise in MR imaging can introduce bias in the estimation of anisotropy and trace. Unlike structural MRI where intensities are primarily used to obtain contrast, the goal of DTI is to quantify the local diffusion properties in each voxel. Therefore, an understanding of the influence of imaging noise on the distribution of measured values is important to understand the results of statistical analysis and to design new imaging protocols. | Clinical time limitations on the acquisition of diffusion weighted volumes in DTI present several key challenges for quantiative statistics of diffusion tensors and tensor-derived measures. First, the signal to noise ratio (SNR) in each individual diffusion weighted volume is relatively low due to the need for quick acquisition. Secondly, the presence of Rician noise in MR imaging can introduce bias in the estimation of anisotropy and trace. Unlike structural MRI where intensities are primarily used to obtain contrast, the goal of DTI is to quantify the local diffusion properties in each voxel. Therefore, an understanding of the influence of imaging noise on the distribution of measured values is important to understand the results of statistical analysis and to design new imaging protocols. | ||
| + | |||
| + | === Project Week Slides === | ||
| + | *[[Media:2007_Project_Half_Week_TensorEstimation.ppt | 4-block PPT Jan 2007]] | ||
| + | *[[Media:2006_Summer_Project_Week_DTI_Processing.ppt | 4-block PPT Jun 2006]] | ||
| + | *[[Media:Riemannian_DTI_ProgWeek2006.ppt | 4-block PPT Jan 2006]] | ||
= Publications = | = Publications = | ||
| − | * Corouge I, Fletcher | + | * Corouge I., Fletcher P.T., Joshi S., Gouttard S., Gerig G. [http://www.na-mic.org/publications/item/view/292Fiber Tract-Oriented Statistics for Quantitative Diffusion Tensor MRI Analysis.] Med Image Anal. 2006 Oct;10(5):786-98. |
* Goodlett C, Corouge I, Jomier M, Gerig G. [http://hdl.handle.net/1926/39 A Quantitative DTI Fiber Tract Analysis Suite]. Insight Journal, 2005. | * Goodlett C, Corouge I, Jomier M, Gerig G. [http://hdl.handle.net/1926/39 A Quantitative DTI Fiber Tract Analysis Suite]. Insight Journal, 2005. | ||
| − | * Corouge I, Fletcher | + | * Corouge I., Fletcher P.T., Joshi S., Gilmore J.H., Gerig G. Fiber Tract-Oriented Statistics for Quantitative Diffusion Tensor MRI Analysis. Int Conf Med Image Comput Comput Assist Interv. 2005;8(Pt 1):131-9. |
| − | * Goodlett C, Davis B, Jean R, Gilmore J, Gerig G. Improved Correspondence for DTI Population Studies via Unbiased Atlas Building. | + | * Goodlett C., Davis B., Jean R., Gilmore J., Gerig G. [http://www.na-mic.org/publications/item/view/303 Improved Correspondence for DTI Population Studies via Unbiased Atlas Building.] Int Conf Med Image Comput Comput Assist Interv. 2006;9(Pt 2):260-7. |
| − | * Goodlett C, Fletcher P T, Lin W, and Gerig G. Noise-induced bias in low-direction diffusion tensor MRI: Replication of Monte-Carlo simulation with in-vivo scans. | + | * Goodlett C., Fletcher P.T., Lin W., and Gerig G. Noise-induced bias in low-direction diffusion tensor MRI: Replication of Monte-Carlo simulation with in-vivo scans. ISMRM 2007 |
| + | * Goodlett C., Fletcher P.T., Lin W., Gerig G. Quantification of Measurement Error in DTI: Theoretical Predictions and Validation. Int Conf Med Image Comput Comput Assist Interv. 2007;10(Pt 1):10-17. | ||
| + | * Goodlett C., Fletcher P.T., Gilmore J.H., Gerig G. Group Statistics of DTI Fiber Bundles Using Spatial Functions of Tensor Measures. Int Conf Med Image Comput Comput Assist Interv. 2008;11(Pt1):1068-1075. | ||
| + | * Goodlett C., Fletcher P.T., Gilmore J.H., Gerig G. Group Analysis of DTI Fiber Tract Statistics with Application to Neurodevelopment. Neuroimage. 2009 Mar;45(1 Suppl):S133-42. | ||
| + | * Gouttard S., Prastawa M., Bullitt E., Lin W., Goodlett C., Gerig G. Constrained Data Decomposition and Regression for Analyzing Healthy Aging from Fiber Tract Diffusion Properties. Int Conf Med Image Comput Comput Assist Interv. 2009;12(Pt 1):321-328. (oral presentation) | ||
= Software = | = Software = | ||
* Algorithms written in ITK. GUI of prototype software written in QT ('''FiberViewer''' software). Prototype software tested in clinical studies at UNC. Validation tests with repeated DTI of same subject (6 cases). [http://www.ia.unc.edu/dev/download/fibertracking/index.htm| FiberTracking download] | * Algorithms written in ITK. GUI of prototype software written in QT ('''FiberViewer''' software). Prototype software tested in clinical studies at UNC. Validation tests with repeated DTI of same subject (6 cases). [http://www.ia.unc.edu/dev/download/fibertracking/index.htm| FiberTracking download] | ||
| − | * Additionally available: ITK compatible fibertracking prototype tool '''FiberTracking''' to be used to study overlap/dissimilarity with other tools already available to NA-MIC: Functionality: reads raw MRI | + | * Additionally available: ITK compatible fibertracking prototype tool '''FiberTracking''' to be used to study overlap/dissimilarity with other tools already available to NA-MIC: Functionality: reads raw DW-MRI data (6 direction Basser scheme), fiber tracking based on user-selected source and regions (S. Mori scheme), display of fibertracts and volumetric data, output: sets of streamlines in ITK polyline format attributedwith DTI properties and display parameteres (radiusof tubes, local color, etc.). [http://www.ia.unc.edu/dev/download/fiberviewer/index.htm| FiberViewer download] |
| + | * Command line tools for DTI processing available from UNC [http://www.ia.unc.edu/dev/ NeuroLib] | ||
Latest revision as of 13:42, 14 May 2010
Home < Algorithm:UNC:DTIContents
Quantitative Tract Analysis
This project proposes a framework for quantitative analysis of DTI data. The framework uses the full tensor information for statistical analysis using the affine-invariant Riemannian metric for defining operations such as interpolation and averaging on tensors. Furtheremore, the results of tractography are used to provide a reference coordinate system the respresents the underlying structure of fiber bundles. The tract modeling framework includes a model both of the geometry of the fiber bundle and of the diffusion properties along the bundle. A new anisotropy measure called geodesic anisotropy (GA) is also included in the framework.
Tract statistics user workflow
Project Week Slides
Population Analysis
Our methodology for population analysis of DT-MRI is based on unbiased non-rigid registration of a population to a common coordinate system. The registration jointly produces an average DTI atlas, which is unbiased with respect to the choice of a template image, along with diffeomorphic correspondence between each image. The registration image match metric uses a feature detector for thin fiber structures of white matter, and interpolation and averaging of diffusion tensors use the Riemannian symmetric space framework. The anatomically significant correspondence provides a basis for comparison of tensor features and fiber tract geometry in clinical studies.
Our registration procedure is based on a scalar feature image which is sensitive to sheet like structures. We have observed that the major fiber bundles of interest occur as sheet or tube like manifolds in the FA image of the brain. As a feature image we use the maximum eigenvalue of the hessian of the FA image. Images are initially aligned using an affine registration and then deformed to a common coordinate system using the unbiased atlas-building procedure of Joshi et al. [1]. The deformation fields produced by the registration process are applied to the tensors fields using appropriate methods for reorienting and interpolating tensors. The transformed images are averaged in the atlas space to produce a DTI atlas.
An initial test was performed by using the procedure on a set of images of healthy subject at age one year. The results of the tensor averaging are shown on the right. Tractography was also performed on the mean atlas image as shown.
Collaboration with PNL
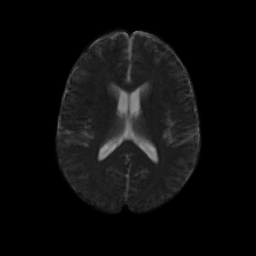
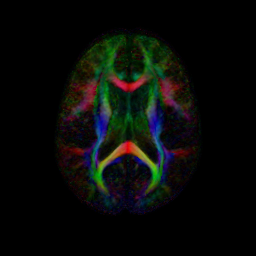
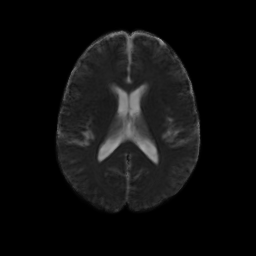
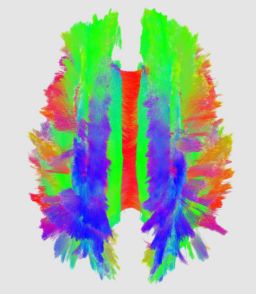
We have begun to apply the DTI atlas building procedure to data provided by the PNL. A combined set of DTI scans from control and Schizophrenic subjects were aligned using the procedure described above. In the atlas space the SZ and CNTL groups are processed to produce voxel-wise statistics for each group. The figure below shows colored FA and mean diffusivity slices for both the CNTL and SZ group. Preliminary work is now being done on region of interest (ROI) hypothesis testing between the two populations.
Noise Statistics
Clinical time limitations on the acquisition of diffusion weighted volumes in DTI present several key challenges for quantiative statistics of diffusion tensors and tensor-derived measures. First, the signal to noise ratio (SNR) in each individual diffusion weighted volume is relatively low due to the need for quick acquisition. Secondly, the presence of Rician noise in MR imaging can introduce bias in the estimation of anisotropy and trace. Unlike structural MRI where intensities are primarily used to obtain contrast, the goal of DTI is to quantify the local diffusion properties in each voxel. Therefore, an understanding of the influence of imaging noise on the distribution of measured values is important to understand the results of statistical analysis and to design new imaging protocols.
Project Week Slides
Publications
- Corouge I., Fletcher P.T., Joshi S., Gouttard S., Gerig G. Tract-Oriented Statistics for Quantitative Diffusion Tensor MRI Analysis. Med Image Anal. 2006 Oct;10(5):786-98.
- Goodlett C, Corouge I, Jomier M, Gerig G. A Quantitative DTI Fiber Tract Analysis Suite. Insight Journal, 2005.
- Corouge I., Fletcher P.T., Joshi S., Gilmore J.H., Gerig G. Fiber Tract-Oriented Statistics for Quantitative Diffusion Tensor MRI Analysis. Int Conf Med Image Comput Comput Assist Interv. 2005;8(Pt 1):131-9.
- Goodlett C., Davis B., Jean R., Gilmore J., Gerig G. Improved Correspondence for DTI Population Studies via Unbiased Atlas Building. Int Conf Med Image Comput Comput Assist Interv. 2006;9(Pt 2):260-7.
- Goodlett C., Fletcher P.T., Lin W., and Gerig G. Noise-induced bias in low-direction diffusion tensor MRI: Replication of Monte-Carlo simulation with in-vivo scans. ISMRM 2007
- Goodlett C., Fletcher P.T., Lin W., Gerig G. Quantification of Measurement Error in DTI: Theoretical Predictions and Validation. Int Conf Med Image Comput Comput Assist Interv. 2007;10(Pt 1):10-17.
- Goodlett C., Fletcher P.T., Gilmore J.H., Gerig G. Group Statistics of DTI Fiber Bundles Using Spatial Functions of Tensor Measures. Int Conf Med Image Comput Comput Assist Interv. 2008;11(Pt1):1068-1075.
- Goodlett C., Fletcher P.T., Gilmore J.H., Gerig G. Group Analysis of DTI Fiber Tract Statistics with Application to Neurodevelopment. Neuroimage. 2009 Mar;45(1 Suppl):S133-42.
- Gouttard S., Prastawa M., Bullitt E., Lin W., Goodlett C., Gerig G. Constrained Data Decomposition and Regression for Analyzing Healthy Aging from Fiber Tract Diffusion Properties. Int Conf Med Image Comput Comput Assist Interv. 2009;12(Pt 1):321-328. (oral presentation)
Software
- Algorithms written in ITK. GUI of prototype software written in QT (FiberViewer software). Prototype software tested in clinical studies at UNC. Validation tests with repeated DTI of same subject (6 cases). FiberTracking download
- Additionally available: ITK compatible fibertracking prototype tool FiberTracking to be used to study overlap/dissimilarity with other tools already available to NA-MIC: Functionality: reads raw DW-MRI data (6 direction Basser scheme), fiber tracking based on user-selected source and regions (S. Mori scheme), display of fibertracts and volumetric data, output: sets of streamlines in ITK polyline format attributedwith DTI properties and display parameteres (radiusof tubes, local color, etc.). FiberViewer download
- Command line tools for DTI processing available from UNC NeuroLib
