Difference between revisions of "Projects:DTIModeling"
| (43 intermediate revisions by 7 users not shown) | |||
| Line 1: | Line 1: | ||
| − | = | + | Back to [[Algorithm:MIT|MIT Algorithms]] |
| + | __NOTOC__ | ||
| + | = DTI Modeling = | ||
| + | |||
| + | We developed a novel approach for joint clustering and point-by-point mapping of white matter fiber pathways. Knowledge of the point correspondence along the fiber pathways is not only necessary for accurate clustering of the trajectories into fiber bundles, but also crucial for any tract-oriented quantitative analysis. The proposed approach is also capable of incorporating anatomical knowledge as prior information. | ||
| + | |||
| + | = Description = | ||
| + | |||
| + | We employ an expectation-maximization (EM) algorithm to cluster the trajectories in a Gamma mixture model context. The result of clustering is the probabilistic assignment of the fiber trajectories to each cluster and an estimate of the cluster parameters, i.e., spatial mean and variance, and point correspondences. The fiber bundles are modeled by the mean trajectory and its spatial variation. Point-by-point correspondence of the trajectories within a bundle is obtained by constructing a distance map and a label map from each cluster center at every iteration of the EM algorithm. This offers a time-efficient alternative to pairwise curve matching of all trajectories with respect to each cluster center. | ||
| + | |||
| + | The proposed method has the potential to benefit from an anatomical atlas of fiber tracts by incorporating it as prior information in the EM algorithm. The algorithm is also capable of handling outliers in a principled way. Here are some examples of modeling/clustering the bundles: | ||
| + | |||
| + | [[Image:models.jpg|Model of fiber tracts]] | ||
| + | |||
| + | [[Image:wholebrain.jpg|Model of fiber tracts|600px]] | ||
| + | |||
| + | One of the difficult bundles of fiber tracts to cluster is the cingulum. Even starting tractography from a user-defined ROI results in a set of disordered trajectories, mostly short in length because of low FA. Also, due to its adjacency to the corpus callosum, many callosal trajectories are included that adversely affect any further analysis of the bundle. As shown in the following figure for two subjects, our method is well capable of clustering these trajectories into the desired bundles. Two arbitrary trajectories, one from the the superior and one from the posterior part of the cingulum were selected as the initial cluster centers. Knowledge of the point correspondence and hence rigorous calculation of the similarity measure is essential for clustering of such a disordered set of trajectories. | ||
| + | |||
| + | [[Image:cingulum.jpg|400px]][[Image:Gamma.jpg|250px]] | ||
| + | |||
| + | Figure on the right illustrates the evolution of the Gamma distribution for the clusters of the first case shown in the above figure. Convergence is achieved just after a few iterations of the EM algorithm. | ||
| + | |||
| + | The proposed algorithm is being applied on several datasets. Below are two examples: | ||
| + | |||
| + | '''Population Study on Pathological Subjects''' | ||
| + | |||
| + | A population study on the cinglum bundle in controls and Schizophrenia cases: | ||
| + | |||
| + | [[Image:Populationstudy.jpg|400px]] | ||
| + | |||
| + | '''Brain Development''' | ||
| + | |||
| + | [[Image:braindevelopment.jpg|400px]][[Image:braindevelopment_qa.jpg|300px]] | ||
| + | |||
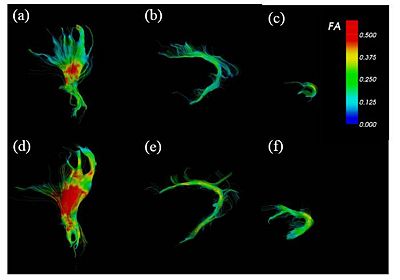
| + | FA-colored trajectories from (a), (d) cortico-spinal, (b), (e) cingulum and (c), (f) uncinate fasciculus at 32-wk (up) and 42-wk (down) postmenstrual age. part of the cingulum and at 32-wk (up) and 42-wk (down) postmenstrual age. Spatial patterns of the tract development are clearly seen. | ||
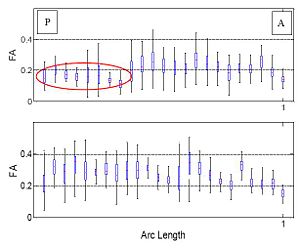
| + | On the right, the figure shows the box-plot of the FA variation along the tract arc length for part of the cingulum and at 32-wk (up) and 42-wk (down) postmenstrual age. Only the posterior part shows a significant FA increase. ROI-based analysis fails to detect such spatial dependencies. | ||
| + | |||
| + | |||
| + | ''Software'' | ||
| + | |||
| + | Currently, all of the codes are implemented in MATLAB. | ||
| − | + | = Key Investigators = | |
| − | |||
| − | |||
| − | + | * MIT: Mahnaz Maddah, Eric Grimson. | |
| − | + | * Harvard: Sandy Wells, Simon Warfield, C-F Westin, Martha E. Shenton, Marek Kubicki. | |
| − | |||
| − | + | = Publications = | |
| − | |||
| − | |||
| − | [ | + | *[http://www.na-mic.org/publications/pages/display?search=Projects%3ADTIModeling&submit=Search&words=all&title=checked&keywords=checked&authors=checked&abstract=checked&sponsors=checked&searchbytag=checked| NA-MIC Publications Databaseon Fiber Tract Modeling, Clustering, and Quantitative Analysis] |
| − | |||
| − | |||
| − | |||
| − | |||
| − | |||
| − | |||
| − | + | [[Category: Shape Analysis]] [[Category:Schizophrenia]] | |
Latest revision as of 10:41, 14 May 2010
Home < Projects:DTIModelingBack to MIT Algorithms
DTI Modeling
We developed a novel approach for joint clustering and point-by-point mapping of white matter fiber pathways. Knowledge of the point correspondence along the fiber pathways is not only necessary for accurate clustering of the trajectories into fiber bundles, but also crucial for any tract-oriented quantitative analysis. The proposed approach is also capable of incorporating anatomical knowledge as prior information.
Description
We employ an expectation-maximization (EM) algorithm to cluster the trajectories in a Gamma mixture model context. The result of clustering is the probabilistic assignment of the fiber trajectories to each cluster and an estimate of the cluster parameters, i.e., spatial mean and variance, and point correspondences. The fiber bundles are modeled by the mean trajectory and its spatial variation. Point-by-point correspondence of the trajectories within a bundle is obtained by constructing a distance map and a label map from each cluster center at every iteration of the EM algorithm. This offers a time-efficient alternative to pairwise curve matching of all trajectories with respect to each cluster center.
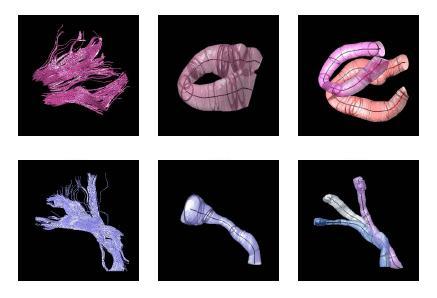
The proposed method has the potential to benefit from an anatomical atlas of fiber tracts by incorporating it as prior information in the EM algorithm. The algorithm is also capable of handling outliers in a principled way. Here are some examples of modeling/clustering the bundles:
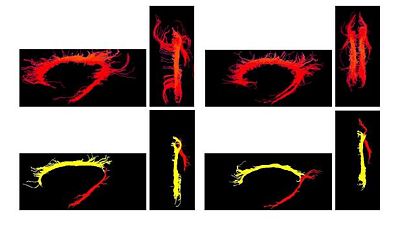
One of the difficult bundles of fiber tracts to cluster is the cingulum. Even starting tractography from a user-defined ROI results in a set of disordered trajectories, mostly short in length because of low FA. Also, due to its adjacency to the corpus callosum, many callosal trajectories are included that adversely affect any further analysis of the bundle. As shown in the following figure for two subjects, our method is well capable of clustering these trajectories into the desired bundles. Two arbitrary trajectories, one from the the superior and one from the posterior part of the cingulum were selected as the initial cluster centers. Knowledge of the point correspondence and hence rigorous calculation of the similarity measure is essential for clustering of such a disordered set of trajectories.
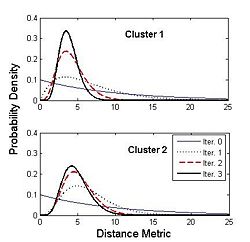
Figure on the right illustrates the evolution of the Gamma distribution for the clusters of the first case shown in the above figure. Convergence is achieved just after a few iterations of the EM algorithm.
The proposed algorithm is being applied on several datasets. Below are two examples:
Population Study on Pathological Subjects
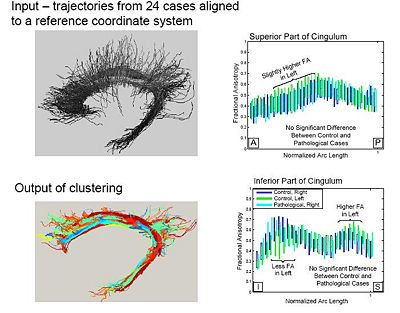
A population study on the cinglum bundle in controls and Schizophrenia cases:
Brain Development
FA-colored trajectories from (a), (d) cortico-spinal, (b), (e) cingulum and (c), (f) uncinate fasciculus at 32-wk (up) and 42-wk (down) postmenstrual age. part of the cingulum and at 32-wk (up) and 42-wk (down) postmenstrual age. Spatial patterns of the tract development are clearly seen. On the right, the figure shows the box-plot of the FA variation along the tract arc length for part of the cingulum and at 32-wk (up) and 42-wk (down) postmenstrual age. Only the posterior part shows a significant FA increase. ROI-based analysis fails to detect such spatial dependencies.
Software
Currently, all of the codes are implemented in MATLAB.
Key Investigators
- MIT: Mahnaz Maddah, Eric Grimson.
- Harvard: Sandy Wells, Simon Warfield, C-F Westin, Martha E. Shenton, Marek Kubicki.
