Difference between revisions of "Hageman:NAMICFluidMechDTITractography"
| Line 48: | Line 48: | ||
* [http://www.loni.ucla.edu LONI Website] | * [http://www.loni.ucla.edu LONI Website] | ||
| − | Project Week Results: [[2008_Winter_Project_Week:Fluid_Mechanics_Tractography|2008 Winter]], [2008_Summer_Project_Week|2008 Summer]] | + | Project Week Results: [[2008_Winter_Project_Week:Fluid_Mechanics_Tractography|2008 Winter]], [[2008_Summer_Project_Week|2008 Summer]] |
Revision as of 09:48, 16 June 2008
Home < Hageman:NAMICFluidMechDTITractography
Fluid Mechanics Based DTI Tractography
Overview
Currently, our project is focused on developing a novel method for diffusion tensor imaging (DTI) tractography modeled on the dynamics of a viscous fluid described by the second order non-linear Navier-Stokes equations. Even though these equations are most commonly seen in the context of fluid mechanics, they have been shown to be successful in modeling a large number of diverse physical phenomena. Our second order nonlinear-based approach is an extension of previous linear PDE methods, but our model contains a viscous force not present in previous methods, represented as an additional convection term in the PDE. We model local viscosity of the fluid as a function of the local intervoxel and intravoxel anisotropy in the corresponding DTI image volume. The incorporation of this convection term in our flow field calculation allows us to closely couple the magnitude of the fluid velocity to the magnitude of the underlying anisotropy of the DTI tensor field, providing a dampening force in background areas, such as gray matter and CSF. This eliminates the need for the white matter mask used by other PDE-based methods to prevent the model from entering these areas. To compute an estimate of the most likely connection path between two regions in the brain, we simulate the flow of an artificial fluid between those two points through a volume whose dimensions, pressure, and local viscosity are derived from the underlying DTI data. We then numerically solve for the fluid velocity vector field. The estimated connection path is then computed by finding the optimal path through the fluid velocity that simultaneously maximizes both the fluid velocity and its gradient.
Computational fluid dynamics is a rich field and, in addition to this tractography method, we are investigating its application to the analysis of diffusion tensor imaging (DTI) datasets for registration and analysis of white matter pathology. We are currently developing several useful and novel diffusion tensor imaging (DTI) analysis algorithms modeled on the principles of fluid mechanics for inclusion within the NA-MIC framework. The goal of this project is to fully develop these methods, make them compatible with the NA-MIC ITK-based software infrastructure (i.e. Slicer), and promote their dissemination to the scientific community.
Description
Our algorithm simulates the flow of an artificial fluid through a volume whose dimensions, viscosity, and pressure tensor field are derived from a DTI volume. Specific regions of interest are chosen as sources and/or sinks, and we simulate the flow of an artificial fluid governed by the Navier-Stokes equations. The most likely connection path is then estimated using a generalized gradient vector flow (GGVF) based approach to compute the trajectory through the fluid velocity vector field that simultaneously maximizes the magnitude of the fluid velocity and its gradient along the path. Our fluid model is valid only as a theoretical framework for generating a connectivity metric and does not try to model any aspect of the underlying diffusion process.
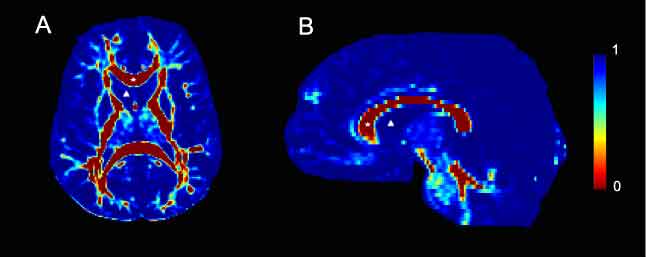
Viscosity maps derived from 2D slices of DTI data from human control subjects. Viscosity values were calculated from the corresponding diffusion tensor image and are color-coded according to the legend bar seen on the right side of the figure. A. Axial slice taken at the level of the internal capsule. The corpus callosum, marked with a star is a highly organized white matter tract and is therefore characterized by low viscosity. Conversely, the lateral ventricle, marked with a delta contains CSF and is highly viscous. B. A mid-sagittal slice. As in A, the corpus callosum is marked with a star and is characterized by low viscosity. In contrast, the lateral ventricular space, marked with a delta contains CSF and therefore has no architecture. Consequently, it is highly viscous.
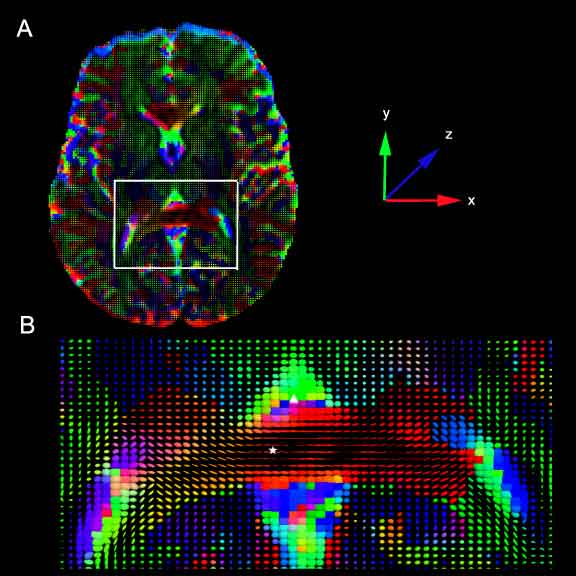
Representations of the pressure tensor derived from 2D slices from human control subjects. At each voxel in the image, the pressure force is represented by a tensor glyph, an ellipsoid whose axis is obtained from a diagonalization of the corresponding pressure tensor. The color of the ellipsoid represents the dominant diffusion direction, according to the color coded axes in the figure with the superior-inferior z-axis (blue) coming out of the page, the anterior-posterior y-axis (green) vertical, and the left-right x-axis (red) horizontal. A. A 2D axial slice taken at the level of the internal capsule. The white box marks the enlarged area shown in B. B. Enlarged view from A. The posterior limb of the corpus callosum, marked with a star is a highly organized white matter tract, and the pressure force acts on the artificial fluid co-linear with the fiber tract. In contrast, the lateral ventricular space, marked with a delta contains little structure. Consequently, the pressure force is isotropic in that region.
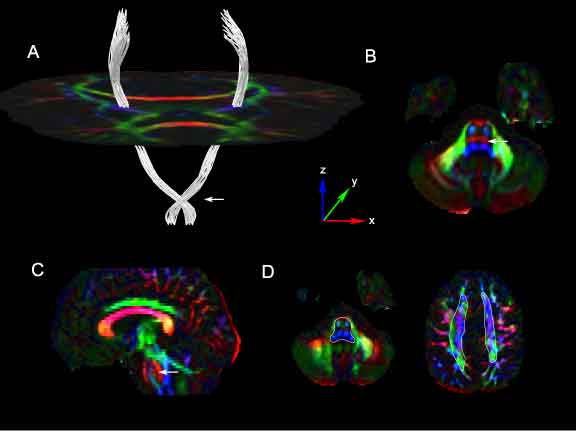
Segmentation results of the corticospinal tracts using our method in human control DTI images. ROIs were placed within the brainstem below the level of the crossing pontine fibers and within the corona radiata above the level of the corpus callosum. Cross-sections of the approximate location of these ROIs are shown Figure 8D, drawn in white, superimposed on the corresponding axial DEC slices. Figure 8A shows the estimated connection paths between these ROIs generated by our method. An axial slice of the tensor glyphs at the level of the mid-brain is shown for spatial reference. The tracts show a prominent lateral course at the level of the mid-pons (Figure 8A: white arrow). This corresponds to a strong lateral diffusion component at that point as seen in the directionally encoded color (DEC) image of the axial slice at the mid-pontine level (Figure 8B, 8C: white arrow). The tensor glyphs and DEC image are color-coded by the axes shown in the figure.
Key Investigators
- UCLA: Nathan Hageman
- UCLA: Arthur Toga, Ph.D
Publications
In Print
In Submission
- Hageman NS, Toga AW, Narr K, Shattuck DW (2008). A diffusion tensor imaging tractography algorithm based on Navier-Stokes fluid mechanics. IEEE Trans. in Medicial Imaging, In Submission.
- Hamilton L, Nuechterlein K, Hageman NS, Woods R, Asarnow R, Alger J, Gaser C, Toga AW, Narr K (2008). Mean Diffusivity and Fractional Anisotropy as Indicators of Schizophrenia and Genetic Vulnerability, Neuroimage, In Submission.
Links
- Hageman NS, Shattuck DW, Narr K, Toga AW (2006). A diffusion tensor imaging tractography method based on Navier-Stokes fluid mechanics. Proceedings of the 2006 IEEE International Symposium on Biomedical Imaging: From Nano to Macro (ISBI 2006), Arlington, VA, USA, 6-9 April 2006. p. 798-801 (PDF)
- LONI Website
Project Week Results: 2008 Winter, 2008 Summer


