Difference between revisions of "Projects:MultiScaleShapeSegmentation"
| Line 8: | Line 8: | ||
== Result == | == Result == | ||
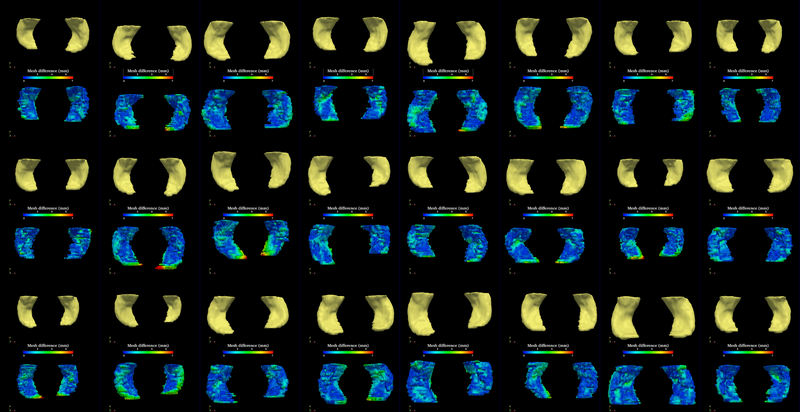
| − | The method is applied on hippocampus. | + | The segmentation method is applied on hippocampus. In the figure below, we show the segmentation results. In the first, third, and the fifth rows, the yellow colored shapes are the segmentation results output by the method. In the second, forth, and sixth rows, the colors on the shapes indicate the difference with the manual segmentation results: For each point on the shape (result of the segmentation algorithm), we compute the closest point on the manual segmented surface, and record the distance to that point. Such distances are encoded by the color shown in those rows. |
[[Image:MultiScaleHippoSegmentationHausdorf.png|800px]] | [[Image:MultiScaleHippoSegmentationHausdorf.png|800px]] | ||
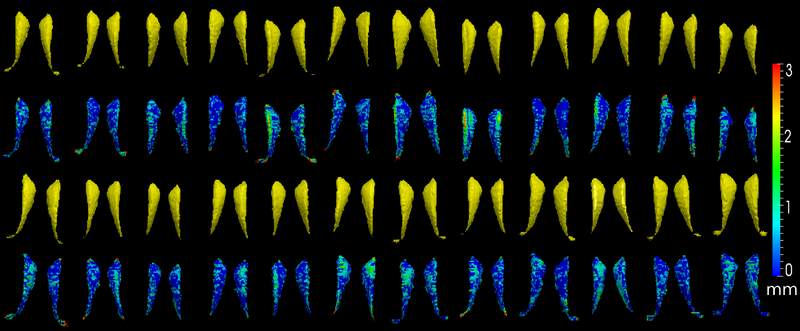
| − | The method is also applied on caudate | + | The method is also applied on caudate. Similarly to the hippocampus cases, in the figure below, we show the segmentation results. In the first and third rows, the yellow colored shapes are the segmentation results output by the method. In the second and forth rows, the colors on the shapes indicate the difference with the manual segmentation results: For each point on the shape (result of the segmentation algorithm), we compute the closest point on the manual segmented surface, and record the distance to that point. Such distances are encoded by the color shown in those rows. |
[[Image:MultiScaleCaudateSegmentationHausdorf.png|800px]] | [[Image:MultiScaleCaudateSegmentationHausdorf.png|800px]] | ||
Revision as of 23:57, 16 October 2011
Home < Projects:MultiScaleShapeSegmentationBack to Georgia Tech Algorithms
Multi-scale Shape Representation and Segmentation With Applications to Radiotherapy
Description
We present in this work a multiscale representation for shapes with arbitrary topology, and a method to segment the target organ/tissue from medical images having very low contrast with respect to surrounding regions using multiscale shape information and local image features. In many previous works, shape knowledge was incorporated by first constructing a shape space from training cases, and then constraining the segmentation process to be within the learned shape space. However, such an approach has certain limitations due to the number of variations in the learned shape space. Moreover, small scale shape variances are usually overwhelmed by those in the large scale, and therefore the local shape information is lost. In this work, first we handle this problem by providing a multiscale shape representation using the wavelet transform. Consequently, the shape variances captured by the statistical learning step are also represented at various scales. In doing so, not only the number of shape variances are largely enriched, but also the small scale changes are nicely captured. Furthermore, in order to make full use of the training information, not only the shape but also the grayscale training images are utilized in a multi-atlas initialization procedure.
Result
The segmentation method is applied on hippocampus. In the figure below, we show the segmentation results. In the first, third, and the fifth rows, the yellow colored shapes are the segmentation results output by the method. In the second, forth, and sixth rows, the colors on the shapes indicate the difference with the manual segmentation results: For each point on the shape (result of the segmentation algorithm), we compute the closest point on the manual segmented surface, and record the distance to that point. Such distances are encoded by the color shown in those rows.
The method is also applied on caudate. Similarly to the hippocampus cases, in the figure below, we show the segmentation results. In the first and third rows, the yellow colored shapes are the segmentation results output by the method. In the second and forth rows, the colors on the shapes indicate the difference with the manual segmentation results: For each point on the shape (result of the segmentation algorithm), we compute the closest point on the manual segmented surface, and record the distance to that point. Such distances are encoded by the color shown in those rows.
Key Investigators
Georgia Tech: Yi Gao and Allen Tannenbaum

