Difference between revisions of "Projects:GenerativeBrainConnectivity"
(Created page with 'Our goal is to use measures of connectivity between various ROIs as an avenue for understanding the structural and functional organization of the brain. We assess functional and …') |
|||
| Line 1: | Line 1: | ||
| + | Back to [[Main_Page|NA-MIC Collaborations]], [[Algorithm:MIT|MIT Algorithms]] | ||
| + | __NOTOC__ | ||
Our goal is to use measures of connectivity between various ROIs as an avenue for understanding the structural and functional organization of the brain. We assess functional and anatomical connectivity using both fMRI correlations and DWI tractography measures, respectively. | Our goal is to use measures of connectivity between various ROIs as an avenue for understanding the structural and functional organization of the brain. We assess functional and anatomical connectivity using both fMRI correlations and DWI tractography measures, respectively. | ||
Revision as of 19:41, 28 November 2012
Home < Projects:GenerativeBrainConnectivityBack to NA-MIC Collaborations, MIT Algorithms
Our goal is to use measures of connectivity between various ROIs as an avenue for understanding the structural and functional organization of the brain. We assess functional and anatomical connectivity using both fMRI correlations and DWI tractography measures, respectively.
Joint Modeling of Anatomical and Functional Connectivity for Population Studies
The interaction between functional and anatomical connectivity provides a rich framework for understanding the brain. Functional connectivity is commonly measured via temporal correlations in resting-state fMRI data. These correlations are believed to reflect the intrinsic functional organization of the brain. Anatomical connectivity is often measured using DWI tractography, which estimates the configuration of underlying white matter fibers. In this work we propose and demonstrate a novel probabilistic framework to infer the relationship between these modalities. The model is based on latent connectivities between brain regions and makes intuitive assumptions about the data generation process. We present a natural extension of the model to population studies, which we use to identify widespread connectivity changes in schizophrenia.
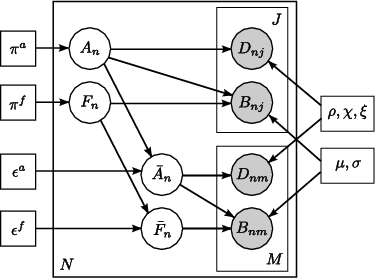
Fig 1. Joint model for the effects of schizophrenia. The pairwise connections are indexed with n=1,...,N. A_n represents the latent anatomical connectivity of the nth connection in the control template, and F_n denotes the corresponding latent functional connectivity. D_nj and B_nj are the observed DWI and fMRI measurements, respectively, for the nth connection in the jth subject in the control population. The schizophrenia templates are identified by an overbar, and the subjects are indexed by m=1,\ldots,M. Squares indicate non-random parameters; circles indicate random variables; observed variables are shaded.
Unlike voxel- and ROI-based analysis, we model the behavior of pairwise connections between regions of the brain. Fig. 1 depicts our generative model. We define two latent variables: anatomical connectivity is a binary random variable that indicates the presence or absence of a direct anatomical pathway between the regions. Functional connectivity is a tri-state random variable that represent little or no functional co-activation, positive functional synchrony, and negative functional synchrony between the regions. These variables specify templates for each (control, schizophrenia) population. Our observed variables are correlations in resting-state fMRI and average FA values along the white matter tracts. We model differences between the groups within the latent connectivities alone and share the data likelihood distributions between the two populations.
Experimental Results
We demonstrate our model on a study of 18 male patients with chronic schizophrenia and 18 male healthy controls. For each subject, an anatomical scan (SPGR, TR=7.4s, TE=3ms, FOV=26cm^2, res=1mm^3), a diffusion-weighted scan (EPI, TR=17s, TE=78ms, FOV=24cm^2, res=1.66x1.66x1.7mm, 51 gradient directions with b=900s/mm^2, 8 baseline scans with b=0s/mm^2) and a resting-state functional scan (EPI-BOLD, TR=3s, TE=30ms, FOV=24cm^2, res=1.875x1.875x3mm) were acquired using a 3T GE Echospeed system.
We segmented the structural images into 77 anatomical regions with Freesurfer. To inject prior clinical knowledge, we pre-selected 8 brain structures (corresponding to 16 regions) that are believed to play a role in schizophrenia: the superior temporal gyrus, rostral middle frontal gyrus, hippocampus, amygdala, posterior cingulate, rostral anterior cingulate, parahippocampal gyrus, and transverse temporal gyrus. We model only the 1096 unique pairwise connections between these ROIs and all other regions in the brain.
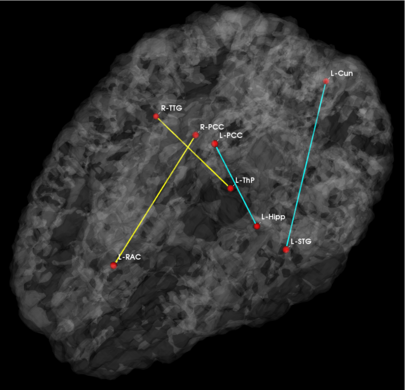
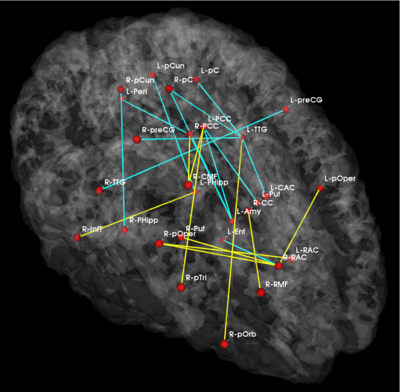
Fig 2. Significant anatomical and functional connectivity differences. Blue lines indicate higher connectivity in the control group; yellow lines indicate higher connectivity in the schizophrenia population.
| Anatomical | Functional |
|---|
Fig. 2 depicts the significantly different anatomical and functional connections identified by the algorithm. As seen, schizophrenia patients exhibit increased functional connectivity between the parietal/posterior cingulate region and the frontal lobe and reduced functional connectivity between the parietal/posterior cingulate region and the temporal lobe. These results confirm the hypotheses of widespread functional connectivity changes in schizophrenia and of functional abnormalities involving the default network.
The differences in anatomical connectivity implicate the superior temporal gyrus and hippocampus. We note that relatively few anatomical connections exhibit significant differences between the two populations. This may stem from our choice of ROIs. In particular, we rely on Freesurfer parcellations, which provide anatomically meaningful correspondences across subjects and mitigate the effects of minor registration errors. However, they may be too big to capture structural differences between the groups. We emphasize that our model can be easily applied to finer scale parcelations in future studies.
Table 1 reports classification accuracies for the generative model and SVM classifiers. Despite not being optimized for classification, our model exhibits above-chance generalization accuracy. We note that even the SVM does not achieve high discrimination accuracy. This underscores the well-documented challenge of finding robust functional and anatomical changes induced by schizophrenia. We stress that our main goal is to explain differences in connectivity. Classification is only presented for validation.
| Table 1. Training and testing accuracy of ten-fold cross validation for the control (NC) and Schizophrenic (SZ) populations. |


