Difference between revisions of "Projects:fMRIClustering"
| Line 3: | Line 3: | ||
= fMRI Clustering = | = fMRI Clustering = | ||
| − | + | One of the major goals in analysis of fMRI data is the detection of networks in the brain with similar functional behavior. A wide variety of methods including hypothesis-driven statistical tests, unsupervised learning methods such as PCA and ICA, and different clustering algorithms have been employed to find these networks. This project aims to more specifically study application of model-based clustering algorithms in identification of functional connectivity in the brain. | |
| − | |||
| − | |||
| − | |||
| − | |||
| − | the | ||
| − | |||
| − | |||
| − | |||
| − | |||
| − | |||
| − | and | ||
| − | |||
| − | |||
= Description = | = Description = | ||
| Line 45: | Line 32: | ||
of all others. It also displays the boundaries of the intrinsic system determined | of all others. It also displays the boundaries of the intrinsic system determined | ||
through the traditional seed selection, showing good agreement between the two | through the traditional seed selection, showing good agreement between the two | ||
| − | partitions. Fig.2 presents the group average of the subject-specific 2-system maps. Color shading shows the proportion of subjects whose clustering agreed with the majority label. | + | partitions. Fig.2 presents the group average of the subject-specific 2-system maps. Color shading shows the proportion of subjects whose clustering agreed with the majority label. Fig.3 shows the group average of a further parcelation of the intrinsic system. |
{| | {| | ||
| Line 61: | Line 48: | ||
|} | |} | ||
| − | Fig. | + | {| |
| + | |+ '''Fig 3. Validation: Parcelation of the intrinsic system.''' | ||
| + | |valign="top"|[[Image:mit_fmri_clustering_intrinsicsystem.png |thumb|900px]] | ||
| + | |} | ||
| + | |||
| + | Fig. 4 shows the results of further clustering the stimulus-driven cluster into two clusters independently for each subject. In order to present a validation of the method, we compare these results with the conventional scheme for detection of visually responsive areas. In Fig. 5, color shows the statistical parametric map while solid lines indicate the boundaries of the visual system obtained through clustering. The results illustrate the agreement between the two methods. Fig. 5 is presenting | ||
{| | {| | ||
| − | |+ '''Fig | + | |+ '''Fig 4. 3-System Parcelation. Results for all 7 subjects.''' |
|valign="top"|[[Image:mit_fmri_clustering_parcellation3_shb1_3.png |400px]] | |valign="top"|[[Image:mit_fmri_clustering_parcellation3_shb1_3.png |400px]] | ||
|- | |- | ||
| Line 75: | Line 67: | ||
{| | {| | ||
| − | |+ '''Fig | + | |+ '''Fig 5. Validation: Visual system.''' |
|valign="top"|[[Image:mit_fmri_clustering_validation.png |thumb|1000px]] | |valign="top"|[[Image:mit_fmri_clustering_validation.png |thumb|1000px]] | ||
|} | |} | ||
| + | |||
''Clustering Study of Domain Specificity in High Level Visual Cortex'' | ''Clustering Study of Domain Specificity in High Level Visual Cortex'' | ||
Revision as of 17:20, 10 November 2007
Home < Projects:fMRIClusteringBack to NA-MIC_Collaborations, MIT Algorithms
fMRI Clustering
One of the major goals in analysis of fMRI data is the detection of networks in the brain with similar functional behavior. A wide variety of methods including hypothesis-driven statistical tests, unsupervised learning methods such as PCA and ICA, and different clustering algorithms have been employed to find these networks. This project aims to more specifically study application of model-based clustering algorithms in identification of functional connectivity in the brain.
Description
Generative Model for Functional Connectivity
In the classical functional connectivity analysis, networks of interest are defined based on correlation with the mean time course of a user-selected `seed' region. Further, the user has to also specify a subject-specific threshold at which correlation values are deemed significant. In this project, we simultaneously estimate the optimal representative time courses that summarize the fMRI data well and the partition of the volume into a set of disjoint regions that are best explained by these representative time courses. This approach to functional connectivity analysis offers two advantages. First, is removes the sensitivity of the analysis to the details of the seed selection. Second, it substantially simplifies group analysis by eliminating the need for the subject-specific threshold. Our experimental results indicate that the functional segmentation provides a robust, anatomically meaningful and consistent model for functional connectivity in fMRI.
We formulate the problem of characterizing connectivity as a partition of voxels into subsets that are well characterized by a certain number of representative hypotheses, or time courses, based on the similarity of their time courses to each hypothesis. We model the fMRI signal at each voxel as generated by a mixture of Gaussian distributions whose centers are the desired representative time courses. Using the EM algorithm to solve the corresponding model-fitting problem, we alternatively estimate the representative time courses and cluster assignments to improve our random initialization.
Experimental Results
We used data from 7 subjects with a diverse set of visual experiments including localizer, morphing, rest, internal tasks, and movie. The functional scans were pre-processed for motion artifacts, manually aligned into the Talairach coordinate system, detrended (removing linear trends in the baseline activation) and smoothed (8mm kernel).
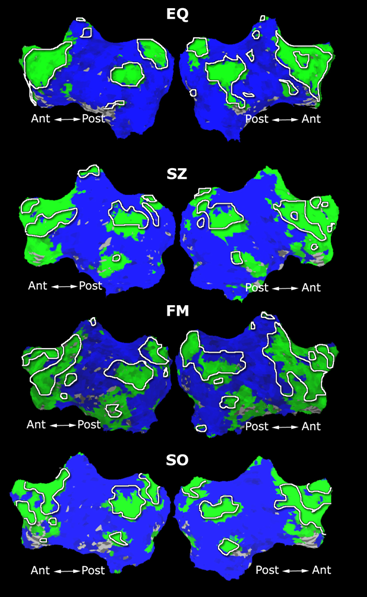
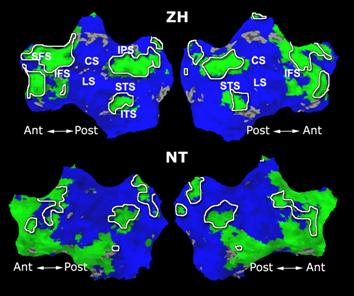
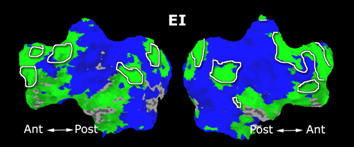
Fig. 1 shows the 2-system partition extracted in each subject independently of all others. It also displays the boundaries of the intrinsic system determined through the traditional seed selection, showing good agreement between the two partitions. Fig.2 presents the group average of the subject-specific 2-system maps. Color shading shows the proportion of subjects whose clustering agreed with the majority label. Fig.3 shows the group average of a further parcelation of the intrinsic system.
|
|
|
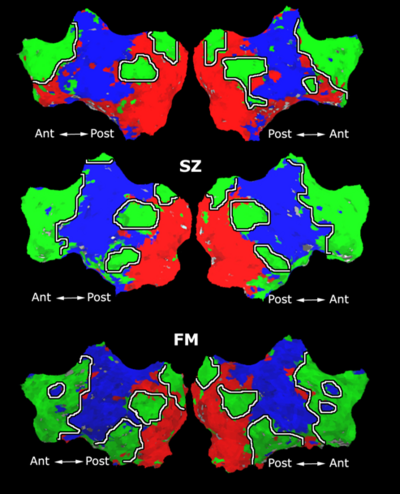
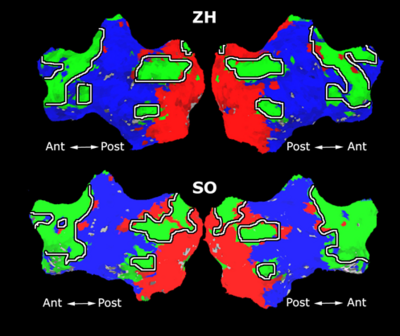
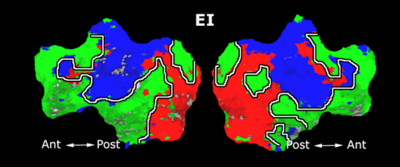
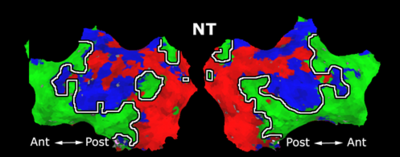
Fig. 4 shows the results of further clustering the stimulus-driven cluster into two clusters independently for each subject. In order to present a validation of the method, we compare these results with the conventional scheme for detection of visually responsive areas. In Fig. 5, color shows the statistical parametric map while solid lines indicate the boundaries of the visual system obtained through clustering. The results illustrate the agreement between the two methods. Fig. 5 is presenting
|
|
|
|
Clustering Study of Domain Specificity in High Level Visual Cortex
blah blah ...
Project Status
- Working 3D implementation in Matlab using the C-based Mex functions.
- Currently porting to ITK. (last updated 18/Apr/2007)
Key Investigators
- MIT: Danial Lashkari, Polina Golland, Nancy Kanwisher
Publications
In print
- P. Golland, Y. Golland, R. Malach. Detection of Spatial Activation Patterns As Unsupervised Segmentation of fMRI Data. In Proceedings of MICCAI: International Conference on Medical Image Computing and Computer Assisted Intervention, 110-118, 2007.
In press
- D. Lashkari, P. Golland. Convex Clustering with Exemplar-Based Models. In NIPS: Advances in Neural Information Processing Systems, 2007.


