Difference between revisions of "Projects:AutomatedShapeModelConstruction"
| Line 1: | Line 1: | ||
| + | Back to [[NA-MIC_Collaborations|NA-MIC_Collaborations]], [[Algorithm:UNC|UNC Algorithms]], [[Algorithm:Utah|Utah Algorithms]] | ||
| + | |||
= Automated Shape Model Construction = | = Automated Shape Model Construction = | ||
| − | |||
| − | |||
| − | |||
| − | |||
We are developing a new method for automatically constructing shape models, including defining boundary correspondences on shapes in a population. This method can be directly applied to segmentations of brain structures from structural MRI. | We are developing a new method for automatically constructing shape models, including defining boundary correspondences on shapes in a population. This method can be directly applied to segmentations of brain structures from structural MRI. | ||
| − | + | = Description = | |
We have implemented a software tool to automatically construct shape models from an input of several binary segmentations. This method finds boundary correspondences by creating the most efficient probability distribution for the population of input shapes. The shape models output by our method can then be used to compare differences in brain structure shape between healthy controls and patients with neuropsychiatric disorders. We are investigating the power of this method in statistical group comparisons. | We have implemented a software tool to automatically construct shape models from an input of several binary segmentations. This method finds boundary correspondences by creating the most efficient probability distribution for the population of input shapes. The shape models output by our method can then be used to compare differences in brain structure shape between healthy controls and patients with neuropsychiatric disorders. We are investigating the power of this method in statistical group comparisons. | ||
| − | |||
{| | {| | ||
| Line 22: | Line 19: | ||
Figure 3 shows the raw p-values from hypothesis testing for group differences as color-maps on mean shapes of the autism group (top row) and the normal control group (bottom row). | Figure 3 shows the raw p-values from hypothesis testing for group differences as color-maps on mean shapes of the autism group (top row) and the normal control group (bottom row). | ||
| − | + | = Publications = | |
| − | |||
| − | |||
| − | + | [http://www.na-mic.org/Special:Publications?text=Projects%3AAutomatedShapeModelConstruction&submit=Search&words=all&title=checked&keywords=checked&authors=checked&abstract=checked&sponsors=checked&searchbytag=checked| NA-MIC Publications Database] | |
| + | |||
| + | = Key Investigators = | ||
* Utah: Joshua Cates, Miriah Meyer, Tom Fletcher, Ross Whitaker | * Utah: Joshua Cates, Miriah Meyer, Tom Fletcher, Ross Whitaker | ||
* Harvard PNL: Sylvain Bouix, Marc Niethammer, Doug Markant, Adam Cohen, Mark Dreusicke, Jim Levitt, Martha Shenton | * Harvard PNL: Sylvain Bouix, Marc Niethammer, Doug Markant, Adam Cohen, Mark Dreusicke, Jim Levitt, Martha Shenton | ||
* UNC: Martin Styner, Heather Cody Hazlett, Joe Piven | * UNC: Martin Styner, Heather Cody Hazlett, Joe Piven | ||
| − | |||
| − | |||
Latest revision as of 01:27, 28 November 2007
Home < Projects:AutomatedShapeModelConstructionBack to NA-MIC_Collaborations, UNC Algorithms, Utah Algorithms
Automated Shape Model Construction
We are developing a new method for automatically constructing shape models, including defining boundary correspondences on shapes in a population. This method can be directly applied to segmentations of brain structures from structural MRI.
Description
We have implemented a software tool to automatically construct shape models from an input of several binary segmentations. This method finds boundary correspondences by creating the most efficient probability distribution for the population of input shapes. The shape models output by our method can then be used to compare differences in brain structure shape between healthy controls and patients with neuropsychiatric disorders. We are investigating the power of this method in statistical group comparisons.
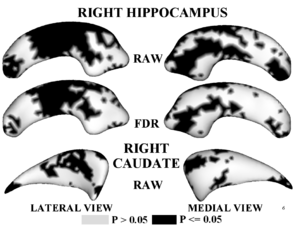
Figure 1,2 illustrates results of hypothesis testing for group differences from the control population for the left/right hippocampus and the left/right caudate. Raw and FDR-corrected p-values are given. Areas of significant group differences ($p <= 0.05$) are shown as dark regions. Areas with insignificant group differences ($p > 0.05$) are shown as light regions. Our results correlate with with other published hypothesis testing results on this data.
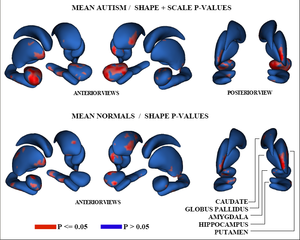
Figure 3 shows the raw p-values from hypothesis testing for group differences as color-maps on mean shapes of the autism group (top row) and the normal control group (bottom row).
Publications
Key Investigators
- Utah: Joshua Cates, Miriah Meyer, Tom Fletcher, Ross Whitaker
- Harvard PNL: Sylvain Bouix, Marc Niethammer, Doug Markant, Adam Cohen, Mark Dreusicke, Jim Levitt, Martha Shenton
- UNC: Martin Styner, Heather Cody Hazlett, Joe Piven


