Difference between revisions of "2008 Engineering review at Utah:FollowUp"
| Line 8: | Line 8: | ||
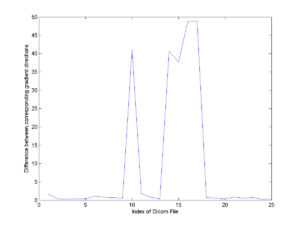
The gradient directions from dicom headers and those from the nrrd header generated at Utah differ. These vectors are not related by a rigid transform. In fact, most of them (20 out of 25) are very close, differ by less than 2.5 degrees (0.77+/-0.47 degrees). [The angle between vectors [0.84 0.54] and [0.83 0.55] is about 0.8 degrees.] The other five directions differ by about 40 degrees. | The gradient directions from dicom headers and those from the nrrd header generated at Utah differ. These vectors are not related by a rigid transform. In fact, most of them (20 out of 25) are very close, differ by less than 2.5 degrees (0.77+/-0.47 degrees). [The angle between vectors [0.84 0.54] and [0.83 0.55] is about 0.8 degrees.] The other five directions differ by about 40 degrees. | ||
| + | |||
| + | {| | ||
| + | |- valign="top" | ||
| + | ! [[Image:Gradient_Vector_Difference_Dicom_Utah_Nrrd.png|thumb|300px|Difference in gradient directions between Dicom and Utah Nrrd]] | ||
| + | |} | ||
| + | |||
The B_values normalized by the largest B_value from dicom header and from Utah nrrd header are close, but not identical. In the Utah nrrd header, the B_value was recorded as 1400 (this is supposed to be the largest B_value). But according to the Dicom header, the largest one is 1000. The B_values from dicom range from 50 to 1000 as multiples of 50. | The B_values normalized by the largest B_value from dicom header and from Utah nrrd header are close, but not identical. In the Utah nrrd header, the B_value was recorded as 1400 (this is supposed to be the largest B_value). But according to the Dicom header, the largest one is 1000. The B_values from dicom range from 50 to 1000 as multiples of 50. | ||
Revision as of 19:13, 3 April 2008
Home < 2008 Engineering review at Utah:FollowUpContents
DWI Analysis
DICOM to NRRD converter
We looked into the diffusion weighted images from Utah acquired on a Siemens scanner. We compared the critical information stored in dicom header and in the nrrd header generated at Utah.
As stated on this page, gradient directions and B_Values are stored in two places in dicom headers. B_values are stored in tag 0019,100c and shadow tag 0029,1010; gradient directions are stored in 0019,100e and 0029,1010. The numbers stored in both places are identical, which means that at minimum, the dicom files are self consistent.
The gradient directions from dicom headers and those from the nrrd header generated at Utah differ. These vectors are not related by a rigid transform. In fact, most of them (20 out of 25) are very close, differ by less than 2.5 degrees (0.77+/-0.47 degrees). [The angle between vectors [0.84 0.54] and [0.83 0.55] is about 0.8 degrees.] The other five directions differ by about 40 degrees.
The B_values normalized by the largest B_value from dicom header and from Utah nrrd header are close, but not identical. In the Utah nrrd header, the B_value was recorded as 1400 (this is supposed to be the largest B_value). But according to the Dicom header, the largest one is 1000. The B_values from dicom range from 50 to 1000 as multiples of 50.
The space direction and measurement frame in the Utah nrrd header are
    space directions: (1.97917,0,0) (0,1.97917,0) (0,0,2)
    measurement frame: (-1,0,0) (0,1,0) (0,0,1)
while ImageOrientationPatient file in the dicom header is
0.999962, 0.00872651, 0; -0.00872651, 0.999962, 0.
When taking the measurement frame and pixel size (1.9791666 in this case) into consideration, the space direction and measurement frame should be
    space directions: (-1.97909,-0.0172712,0) (0.0172712,-1.97909,0) (0,0,2)
    measurement frame: (1,0,0) (0,1,0) (0,0,1)
