Difference between revisions of "DBP2:UNC:Cortical Thickness Comparison"
| Line 16: | Line 16: | ||
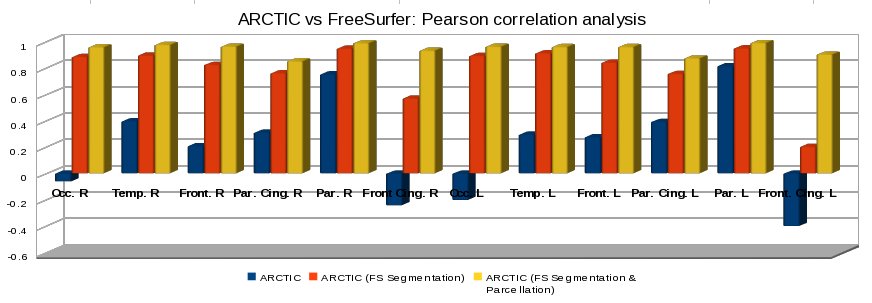
When we consider our own tissue segmentation algorithm and our own parcellation map (blue histogram) ARCTIC and FreeSurfer do not seem to correlate well, except for the parietal lobe. However, using directly FreeSurfer's tissue segmentation (red histogram), the two methods are highly correlated for almost all the lobes (r > 0.75), except the frontal cingulate. This correlation slightly improves (yellow histogram, r > 0.85) when we additionally use FreeSurfer's lobar parcellation in our own cortical thickness computation. The tissue segmentation clearly has a strong impact in the cortical thickness computation. Visual comparisons indicate that both segmentations seem equally appropriate, though FreeSurfer’s tissue segmentation procedure leads to larger white matter regions and a better coverage of gyral white matter in deeply folded areas. This study showed a strong correlation between our cortical thickness method and FreeSurfer's. | When we consider our own tissue segmentation algorithm and our own parcellation map (blue histogram) ARCTIC and FreeSurfer do not seem to correlate well, except for the parietal lobe. However, using directly FreeSurfer's tissue segmentation (red histogram), the two methods are highly correlated for almost all the lobes (r > 0.75), except the frontal cingulate. This correlation slightly improves (yellow histogram, r > 0.85) when we additionally use FreeSurfer's lobar parcellation in our own cortical thickness computation. The tissue segmentation clearly has a strong impact in the cortical thickness computation. Visual comparisons indicate that both segmentations seem equally appropriate, though FreeSurfer’s tissue segmentation procedure leads to larger white matter regions and a better coverage of gyral white matter in deeply folded areas. This study showed a strong correlation between our cortical thickness method and FreeSurfer's. | ||
| − | |||
| − | |||
See results detailed on [[Media:UNCDBP2_ARCTIC_Freesurfer_Evaluation.xls | spreadsheet]]. | See results detailed on [[Media:UNCDBP2_ARCTIC_Freesurfer_Evaluation.xls | spreadsheet]]. | ||
Revision as of 19:57, 27 August 2010
Home < DBP2:UNC:Cortical Thickness ComparisonBack to UNC Cortical Thickness Roadmap, UNC Regional Cortical Thickness Pipeline
Objective
We would like to evaluate ARCTIC with state of the art techniques, such as FreeSurfer. Thus a statistical analysis, based on Pearson's correlation, has been completed on FreeSurfer's tutorial dataset which includes 40 adult cases. Test were also performed on a longitudinal autism study of 86 subject aged 2-4 years.
Pearson's correlation analysis
Method
A statistical analysis, based on Pearson's correlation analysis of the lobar average cortical thickness measurements, has then been completed. We first used FreeSurfer’s tutorial dataset consisting of 40 healthy subjects, ranging in age from 18 to 93. As our lobar parcellation map differs from FreeSurfer's, cortical regions needed to be optimally matched. Finally, 12 lobar comparable regions (left and right) were considered: frontal, frontal cingulate, parietal cingulate, parietal, occipital and temporal lobes.
Results
When we consider our own tissue segmentation algorithm and our own parcellation map (blue histogram) ARCTIC and FreeSurfer do not seem to correlate well, except for the parietal lobe. However, using directly FreeSurfer's tissue segmentation (red histogram), the two methods are highly correlated for almost all the lobes (r > 0.75), except the frontal cingulate. This correlation slightly improves (yellow histogram, r > 0.85) when we additionally use FreeSurfer's lobar parcellation in our own cortical thickness computation. The tissue segmentation clearly has a strong impact in the cortical thickness computation. Visual comparisons indicate that both segmentations seem equally appropriate, though FreeSurfer’s tissue segmentation procedure leads to larger white matter regions and a better coverage of gyral white matter in deeply folded areas. This study showed a strong correlation between our cortical thickness method and FreeSurfer's.
See results detailed on spreadsheet.
Tests on a longitudinal pediatric autism study
In addition to the FreeSurfer tutorial data, we also tested both tools on a longitudinal autism study of 86 subject aged 2-4 years. FreeSurfer showed a low success rate even with manual interventions (< 40% success without intervention, < 70% success after manual intervention), whereas our ARCTIC tool showed no apparent failures. This comparison is though a bit unfair, as we used a pediatric atlas for ARCTIC, whereas FreeSurfer employed its adult template. Our ongoing efforts to use the ARCTIC segmentation maps as input for FreeSurfer were thus far unsuccessful to raise the overall success rate.
