Difference between revisions of "Projects:AFibLongitudinalAnalysis"
(→Method) |
|||
| Line 8: | Line 8: | ||
Four sets of shapes are input to the algorithm. The first set contains the shapes of the CG group taken at time 0. The second set contains the shapes of the same group taken at time 1. The third sets are the shapes of the RG group at time 0 and the fourth sets are the RG group at time 1. | Four sets of shapes are input to the algorithm. The first set contains the shapes of the CG group taken at time 0. The second set contains the shapes of the same group taken at time 1. The third sets are the shapes of the RG group at time 0 and the fourth sets are the RG group at time 1. | ||
| − | + | Subsequently, the shapes evolution profiles between two time points, for both groups, are constructed. This enables a continuous evolution path for both shape groups. | |
| + | |||
| + | The evolution paths are then traced and statistical tests are performed to evaluate the p-value maps indicating the differences between the two groups. | ||
= Results = | = Results = | ||
Revision as of 02:56, 24 November 2012
Home < Projects:AFibLongitudinalAnalysisBack to Boston University Algorithms
Description
The shape evolution of the left atrium in the atrial fibrillation patiens is studied longitudinally to reveal the difference between recover group (CG) and the AFib recurrence group (RG).
Method
Four sets of shapes are input to the algorithm. The first set contains the shapes of the CG group taken at time 0. The second set contains the shapes of the same group taken at time 1. The third sets are the shapes of the RG group at time 0 and the fourth sets are the RG group at time 1.
Subsequently, the shapes evolution profiles between two time points, for both groups, are constructed. This enables a continuous evolution path for both shape groups.
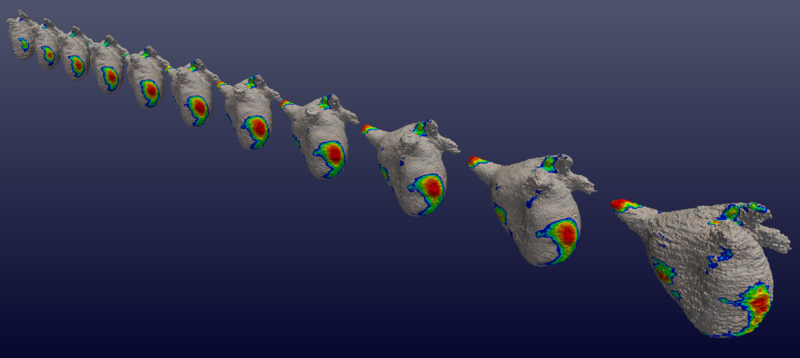
The evolution paths are then traced and statistical tests are performed to evaluate the p-value maps indicating the differences between the two groups.
Results
Shape difference. From left to right: mean shapes with p-value map at time 0, 0.1, ..., 1.0.
Key Investigators
- BWH: Yi Gao and Sylvain Bouix
- Georgia Tech: Liangjia Zhu
- Boston University: Allen Tannenbaum
