Difference between revisions of "Projects:GenerativeBrainConnectivity"
| Line 13: | Line 13: | ||
<tr> <td align="center"> | <tr> <td align="center"> | ||
[[Image:NetworkBrain.png |300px]] | [[Image:NetworkBrain.png |300px]] | ||
| − | <td align="center"> | + | <td align="center">U+0009 |
<td align="center"> | <td align="center"> | ||
[[Image:TreeModel.png |300px]] | [[Image:TreeModel.png |300px]] | ||
Revision as of 21:01, 28 November 2012
Home < Projects:GenerativeBrainConnectivityBack to NA-MIC Collaborations, MIT Algorithms
Our goal is to use measures of connectivity between various ROIs as an avenue for understanding the structural and functional organization of the brain. We assess functional and anatomical connectivity using both fMRI correlations and DWI tractography measures, respectively.
From Brain Connectivity Models to Identifying Foci of a Neurological Disorder
Aberrations in functional connectivity inform us about neuropsychiatric disorders. Functional connectivity is measured via temporal correlations in resting-state functional Magnetic Resonance Imaging (fMRI). Although various studies identify functional connections affected by a clinical disease, connectivity results are difficult to interpret and validate. Specifically, the bulk of our knowledge about the brain is organized around regions (i.e., functional localization, tissue properties, morphometry) and not the connections between them. Moreover, it is nearly impossible to design non-invasive experiments that target a particular connection between two brain regions. In contrast to prior work, we propose a novel framework that pinpoints regions, which we call ``foci", whose functional connectivity patterns are the most disrupted by the disorder.
Using a probabilistic setting, we define a latent (hidden) graph that characterizes the network of abnormal functional connectivity emanating from the affected brain regions. This generates population differences in the observed fMRI correlations. We use neural anatomy as a substrate for modeling functional connectivity. In particular, we rely on Diffusion Weighted Imaging (DWI) tractography to estimate the underlying white matter fibers in the brain. Since neural communication is constrained by white matter fibers, we hypothesize that the strongest effects of a disorder will occur along direct anatomical connections. Hence, we model whole-brain functional connectivity but only use functional abnormalities between anatomically connected regions to identify the disease foci.
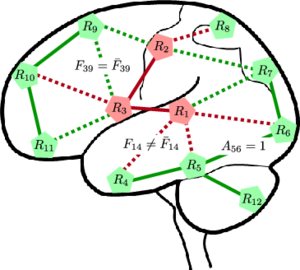
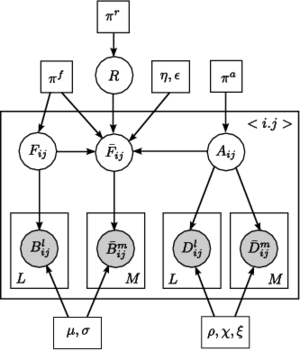
Fig 1. (Left) A network model of connectivity. The nodes correspond to regions in the brain, and the lines denote anatomical connections between them. The green nodes and edges are normal. The red nodes are foci of the disease, and the red edges specify pathways of abnormal functional connectivity. The solid lines are deterministic given the region labels; the dashed lines are probabilistic. (Right) Graphical model representation. Vector R specifies diseased regions. A_ij and F_ij represent the latent anatomical and functional connectivity, respectively, between regions i and j. Variables associated with the diseased population are identified by an overbar. Boxes denote non-random parameters; circles indicate random variables; shaded variables are observed.
| U+0009 |
The nodes in Fig. 1 correspond to regions in the brain. The green nodes are healthy, and the red nodes are diseased. The edges denote neural connections, which are captured by latent anatomical connectivity A_ij. Specifically, the presence or absence of edge in the network is governed by the value of A_ij. The anatomical network structure is shared between the control and clinical populations. The regions in this work correspond to (large) Brodmann areas. Prior results in the field suggest that the anatomical differences between schizophrenia patients and normal controls are very small in this case.
Based on the region assignments, aberrant functional connectivity along anatomical pathways is defined using a simple set of rules: (1) a connection between two diseased regions is always abnormal (solid red lines in Fig. 1, (2) a connection between two healthy regions is never abnormal (solid green lines), and (3) a connection between a healthy and a diseased region is abnormal with some unknown probability (dashed lines). We use latent functional connectivity to model the neural synchrony between two regions in the control and clinical populations. Ideally, the connectivity should be the same for healthy connections and different for abnormal connections. However, due to noise, we assume that the latent templates can deviate from the above rules with some small probability.
The observed DWI measurements D and fMRI correlations B provide noisy information about the latent network structure.
Experimental Results
We demonstrate our model on a study of 18 male patients with chronic schizophrenia and 18 male healthy controls. For each subject, an anatomical scan (SPGR, TR=7.4s, TE=3ms, FOV=26cm^2, res=1mm^3), a diffusion-weighted scan (EPI, TR=17s, TE=78ms, FOV=24cm^2, res=1.66x1.66x1.7mm, 51 gradient directions with b=900s/mm^2, 8 baseline scans with b=0s/mm^2) and a resting-state functional scan (EPI-BOLD, TR=3s, TE=30ms, FOV=24cm^2, res=1.875x1.875x3mm) were acquired using a 3T GE Echospeed system.
We segmented the structural images into 77 anatomical regions with Freesurfer. The DWI data is analyzed using a two-tensor tractography algorithm. The connectivity measure is the average FA along all detected fibers between regions. The measure is set to zero if no tracts are found. We compute the fMRI connectivity as the Pearson correlation coefficient between the mean time courses of the two regions.
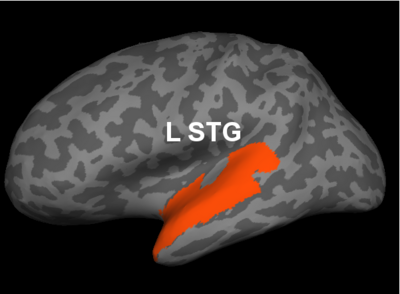
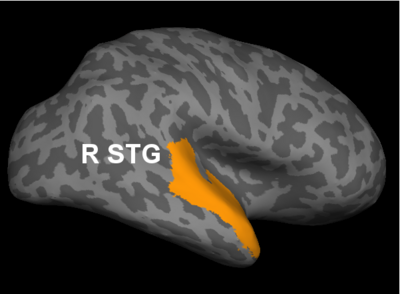
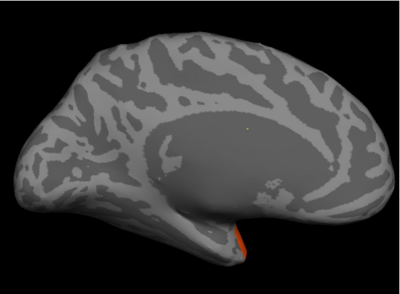
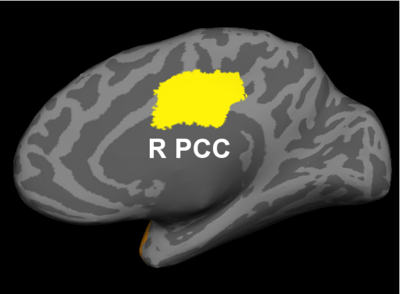
Fig 2. Significant regions based on permutation tests. The colorbar corresponds to the negative log p-value. We present the lateral and medial viewpoints for each hemisphere. The highlighted regions are the posterior cingulate (R PCC) and the superior temporal gyrus (L STG & R STG).
Prior studies have found abnormalities in the superior temporal gyri in schizophrenia. These impairments correlate with clinical measures of auditory hallucination and attentional deficits. The default network has been implicated in resting-state fMRI studies. Reduced connectivity in the posterior cingulate correlate with both positive and negative symptoms of schizophrenia.
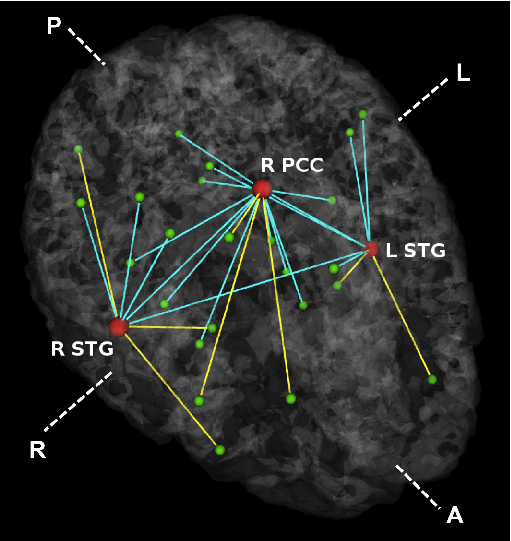
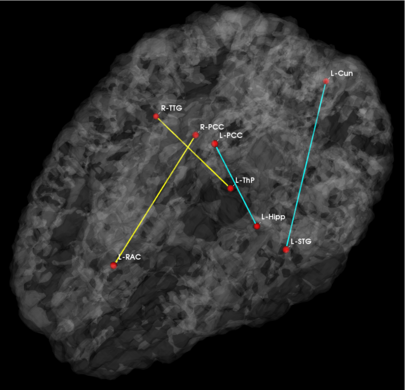
Fig 3. Estimated graph of functional connectivity differences. The red nodes indicate the disease foci. Blue lines indicate reduced functional connectivity and yellow lines indicate increased functional connectivity in the schizophrenia population.
In Fig. 3, we observe that functional abnormalities originating in the posterior cingulate project to the midbrain and frontal lobe, whereas abnormalities stemming from the right and left superior temporal gyri tend to span their respective hemispheres. Overall, schizophrenia patients exhibit reduced functional connectivity. Of notable exception are connections to the frontal lobe. This phenomenon has been reported in prior studies of schizophrenia and is believed to interfere with perception by misdirecting attentional resources.
Joint Modeling of Anatomical and Functional Connectivity for Population Studies
The interaction between functional and anatomical connectivity provides a rich framework for understanding the brain. Functional connectivity is commonly measured via temporal correlations in resting-state fMRI data. These correlations are believed to reflect the intrinsic functional organization of the brain. Anatomical connectivity is often measured using DWI tractography, which estimates the configuration of underlying white matter fibers. In this work we propose and demonstrate a novel probabilistic framework to infer the relationship between these modalities. The model is based on latent connectivities between brain regions and makes intuitive assumptions about the data generation process. We present a natural extension of the model to population studies, which we use to identify widespread connectivity changes in schizophrenia.
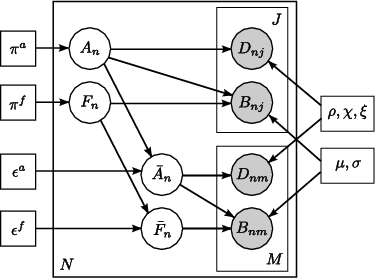
Fig 4. Joint model for the effects of schizophrenia. The pairwise connections are indexed with n=1,...,N. A_n represents the latent anatomical connectivity of the nth connection in the control template, and F_n denotes the corresponding latent functional connectivity. D_nj and B_nj are the observed DWI and fMRI measurements, respectively, for the nth connection in the jth subject in the control population. The schizophrenia templates are identified by an overbar, and the subjects are indexed by m=1,\ldots,M. Squares indicate non-random parameters; circles indicate random variables; observed variables are shaded.
Unlike voxel- and ROI-based analysis, we model the behavior of pairwise connections between regions of the brain. Fig. 4 depicts our generative model. We define two latent variables: anatomical connectivity is a binary random variable that indicates the presence or absence of a direct anatomical pathway between the regions. Functional connectivity is a tri-state random variable that represent little or no functional co-activation, positive functional synchrony, and negative functional synchrony between the regions. These variables specify templates for each (control, schizophrenia) population. Our observed variables are correlations in resting-state fMRI and average FA values along the white matter tracts. We model differences between the groups within the latent connectivities alone and share the data likelihood distributions between the two populations.
Experimental Results
We demonstrate our model on a study of 18 male patients with chronic schizophrenia and 18 male healthy controls. For each subject, an anatomical scan (SPGR, TR=7.4s, TE=3ms, FOV=26cm^2, res=1mm^3), a diffusion-weighted scan (EPI, TR=17s, TE=78ms, FOV=24cm^2, res=1.66x1.66x1.7mm, 51 gradient directions with b=900s/mm^2, 8 baseline scans with b=0s/mm^2) and a resting-state functional scan (EPI-BOLD, TR=3s, TE=30ms, FOV=24cm^2, res=1.875x1.875x3mm) were acquired using a 3T GE Echospeed system.
We segmented the structural images into 77 anatomical regions with Freesurfer. To inject prior clinical knowledge, we pre-selected 8 brain structures (corresponding to 16 regions) that are believed to play a role in schizophrenia: the superior temporal gyrus, rostral middle frontal gyrus, hippocampus, amygdala, posterior cingulate, rostral anterior cingulate, parahippocampal gyrus, and transverse temporal gyrus. We model only the 1096 unique pairwise connections between these ROIs and all other regions in the brain.
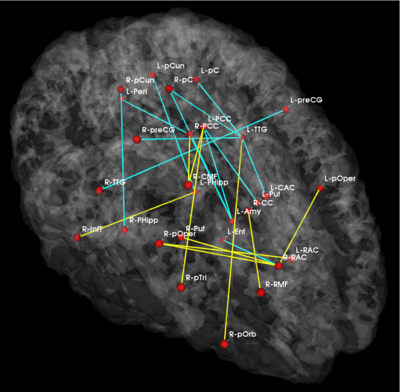
Fig 5. Significant anatomical and functional connectivity differences. Blue lines indicate higher connectivity in the control group; yellow lines indicate higher connectivity in the schizophrenia population.
| Anatomical | Functional |
|---|
Fig. 5 depicts the significantly different anatomical and functional connections identified by the algorithm. As seen, schizophrenia patients exhibit increased functional connectivity between the parietal/posterior cingulate region and the frontal lobe and reduced functional connectivity between the parietal/posterior cingulate region and the temporal lobe. These results confirm the hypotheses of widespread functional connectivity changes in schizophrenia and of functional abnormalities involving the default network.
The differences in anatomical connectivity implicate the superior temporal gyrus and hippocampus. We note that relatively few anatomical connections exhibit significant differences between the two populations. This may stem from our choice of ROIs. In particular, we rely on Freesurfer parcellations, which provide anatomically meaningful correspondences across subjects and mitigate the effects of minor registration errors. However, they may be too big to capture structural differences between the groups. We emphasize that our model can be easily applied to finer scale parcelations in future studies.
Table 1 reports classification accuracies for the generative model and SVM classifiers. Despite not being optimized for classification, our model exhibits above-chance generalization accuracy. We note that even the SVM does not achieve high discrimination accuracy. This underscores the well-documented challenge of finding robust functional and anatomical changes induced by schizophrenia. We stress that our main goal is to explain differences in connectivity. Classification is only presented for validation.
| Table 1. Training and testing accuracy of ten-fold cross validation for the control (NC) and Schizophrenic (SZ) populations. |
Key Investigators
- MIT: Archana Venkataraman, Polina Golland
- Harvard: Carl-Frederik Westin, Marek Kubicki
