Difference between revisions of "Algorithm:UNC:DTI:Quantitative Tract Analysis"
From NAMIC Wiki
| Line 1: | Line 1: | ||
= Description = | = Description = | ||
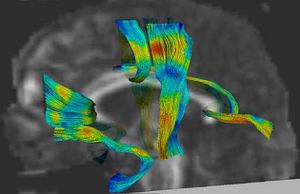
| + | Tractography has commonly been used to visualize the geometry of fiber tract bundles. The aim of this project is to use tractography as a reference coordinate system for doing fiber tract statistics along a bundle. | ||
| + | [[image:corouge_dti_statistics.jpg|thumb|Fiber tracts with colored FA attributes]] | ||
= Publications = | = Publications = | ||
Latest revision as of 19:46, 2 April 2007
Home < Algorithm:UNC:DTI:Quantitative Tract AnalysisDescription
Tractography has commonly been used to visualize the geometry of fiber tract bundles. The aim of this project is to use tractography as a reference coordinate system for doing fiber tract statistics along a bundle.
Publications
- Isabelle Corouge, P.Thomas Fletcher, Sarang Joshi, Sylvain Gouttard, Guido Gerig, Fiber Tract-Oriented Statistics for Quantitative Diffusion Tensor MRI Analysis. Medical Image Analysis 10 (2006), 786 - 798 PDF
- C. Goodlett, I. Corouge, M. Jomier, and G. Gerig, A Quantitative DTI Fiber Tract Analysis Suite, The Insight Journal, vol. ISC/NAMIC/ MICCAI Workshop on Open-Source Software, 2005, Online publication
- Corouge, I., Fletcher, T., Joshi, S., Gilmore J.H., and Gerig, G., Fiber Tract-Oriented Statistics for Quantitative Diffusion Tensor MRI Analysis, Lecture Notes in Computer Science LNCS, James S. Duncan and Guido Gerig, editors, Springer Verlag, Vol. 3749, Oct. 2005, pp. 131 -- 138 PDF
Software
- Algorithms written in ITK. GUI of prototype software written in QT (FiberViewer software). Prototype software tested in clinical studies at UNC. Validation tests with repeated DTI of same subject (6 cases). FiberTracking download
- Additionally available: ITK compatible fibertracking prototype tool FiberTracking to be used to study overlap/dissimilarity with other tools already available to NA-MIC: Functionality: reads raw MRI-DT data (6 direction Basser scheme), fiber tracking based on user-selected source and regions (S. Mori scheme), display of fibertracts and volumetric data, output: sets of streamlines in ITK polyline format attributedwith DTI properties and display parameteres (radiusof tubes, local color, etc.). FiberViewer download
