AHM2009:PNL
PNL Roadmap Project
Overview
- What problem does the pipeline solve?
Most tractography methods (Deterministic/Principal Diffusion Direction) estimate fibers by tracing the maximum direction of diffusion. A limitation of this approach is that, in practice, several factors introduce uncertainty in the tracking procedure, including, noise, splitting and crossing fibers, head motion and image artifacts. Stochastic tractography attempts to quantify the uncertainty associated with estimated fibers, by using a propagation model based on stochastics and regularization, which allows paths originating at one point to branch and return a probability distribution of possible paths. Based on probability functions, using a sequential importance sampling technique (Bjornemo et al., 2002), one can generate thousands of fibers starting in the same point by sequentially drawing random step directions. This gives a very rich model of the fiber distribution, as contrasted with single fibers produced by conventional tractography methods. Moreover, from a large number of sampled paths, probability maps can be generated, providing better estimates of connectivity between several anatomical locations.
- Who is the targeted user?
Since diffusion direction uncertainty within the gray matter is quite significant; principal diffusion direction approaches usually do not work for tracking between two gray matter regions. Thus if one requires finding connections between a priori selected anatomical gray matter regions, defined either by anatomical segmentations (in case of using structural ROI data), or functional activations (in case of megring DTI with fMRI), stochastic tractography seems to be the method of choice. Stochastic Tractography is also comparable, if not better, in defining large white matter fiber bundles, especially those traveling through white matter regions characterized by increased diffusion uncertainty (fiber crossings).
- How does the pipeline compare to state of the art?
To date, there are two popular toolboxes that include probabilistic/stochastic tractography modules. Functionality of both modules (FSL and PICO) is limited, and software is not open source.
Detailed Information about the Pipeline
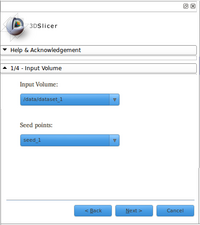
Can be found in: MODULES > PYTHON MODULES > PYTHON STOCHASTIC TRACTOGRAPHY Functionality of Python Stochastic Tractography module in Slicer 3.0
- Loading volumes:
Module reads files (DWI and ROIs) in nhdr format.
- Smoothing:
One can smooth the DWI data (only Gausian smoothing is supported at this time). We recommend it if the data is noisy.
- Masks:
Masks are removing some of the unwanted tracts, same way principal diffusion direction tractography uses stopping criteria for tractography termination. Three different methods for masking are provided.
- 1. Otsu Mask- a thresholding method that is based on T2 intensity
- 2. WM Mask- a thresholding method based on FA intensity
- 3. Artifact removal- one can use its own WM mask, obtained from T1 or T2 segmentation, and registered to DWI space, then artifact removal compares WM mask with FA map, and patches WM mask with voxels that have high FA values.
- Tensor estimation:
Module uses two methods for estimating tensors, and can output anisotropy indices (FA/Mode/Trace), if requested
- Stochastic Tractography:
Parameters that need to be adjusted:
- 1. The amount of tracts that will be seeded from each voxel (we recommend between 500 and 1000 tracts, depending on the workstation power- 1000 tracts per voxel seeded within the large ROI for high resolution DWI can take a long time to compute).
- 2. maximum tract length (in mm), this can eliminate long, unwanted tracts if the regions for which connection is measured are located close to each other
- 3. Step Size: distance between each re-estimation of tensors, usually between 0.5 and 1 mm
- 4. Spacing???
- 5. Stopping criteria. This can be used on the top of WM mask, to terminate tracts (in case they really want to travel through the CSF, for example).
- Probability Map:
This step creates output probability maps.
- 1. rough: each voxel is counted only once if at least one fiber pass through it
- 2. cumulative:Tracts are summed by voxel independently
- 3. discriminative: tracts are summed by voxel depending on their length
Then, probability maps can be saved as ROIs, and either used directly, or thresholded (at certain probability, step claimed by few publications to remove noise) in slicer to mask and compute average FA, Mode, Trace for entire connection. Diffusion indices can be also weighted by the probability of connection for each voxel.
- Demonstrate parameters/steps that need to be adjusted using someone else's data
Software & documentation
- Download Slicer 3.0 here.
- Training Dataset
- Training Presentation
- Training Webcast (Theora format)
Team
- DBP: Marek Kubicki, MD, PhD, Sylvain Bouix, PhD, Julien Von Siebenthal, PhD, Doug Terry, BS
Psychiatry Neuroimaging Laboratory, Department of Psychiatry, Brigham and Women's Hospital, Harvard Medical School Boston, MA
- Core 1: Polina Gollard, MIT
- Core 2: Brad Davis, Steve Pieper, Kitware
Outreach
- Visit our publication database.
- Planned outreach activities (including presentations, tutorials/workshops) at conferences


