Projects:LocalStatisticalAnalysisViaPermutationTests
Back to NA-MIC Collaborations, UNC Algorithms, Utah Algorithms
Local Statistical Analysis via Permutation Tests
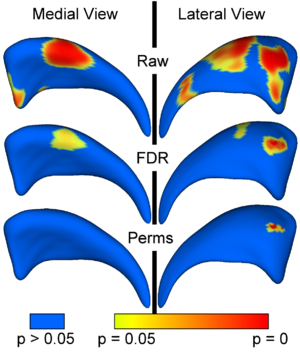
As part of NA-MIC, we have developed two statistical frameworks for computing shape analysis of 3D surfaces, both based on permutation tests. The first framework is useful for straightforward group difference testing and computes differences locally for every surface point via the standard robust Hotelling T^2 two sample metric. The second one compute locally first a Generalized Linear Model (GLM) followed by a MANCOVA based metric computation for group difference testing. The second framework also allows the computation of correlation statistics with the GLM fitted shape coordinates. In both cases, out tools will proveide statistical p-value maps, both raw and corrected for multiple comparisons, as well as mean difference magnitude and vector maps, group covariance maps, correlation maps and z-score maps.
Description
Shape Statistics: Permutation tests
The local shape analysis involves testing from a few to many thousands of hypothesis (one per surface point) for statistically significant effects. At each surface point, we propose to perform a separate statistical test that analyzes either the local coordinate (in a general group difference shape study) or the change difference vector (in a longitudinal study or twin study). Here we present a set of methods for computing a) the local shape metric as well as b) the global correction for doing multiple (local) tests. For the shape metric, two separate methods were developed for different use scenarios depending on whether correction for / correlation with patient variables such as gender, age or clinical scores is needed.
The most common measure of multiple false positives is the familywise error rate (FWER). The multiple testing problem has been an active area of research in the functional neuroimaging community. One of the widely used methods in the analysis of neuroimaging data makes inferences based on the maximum distribution. Common to both testing framework is the use of non-parametric permutation tests to estimate uniformly sensitive extrema distributions. The correction method is based on computing first the local p-values using permutation tests. The minimum of these p-values across the surface is then computed for every permutation. The appropriate corrected p-value at level α can then be obtained by the computing the value at the α-quantile in the histogram of these minimum values. Using the minimum statistic of the p-values, this method correctly controls for the FWER, or the false positives, but no control of the false negatives is provided. The resulting corrected local significance values can thus be regarded as pessimistic estimates akin to a simple Bonferroni correctection.
Additionally to the non-parametric permutation correction, we have also implemented and applied a False Discovery Rate Estimation (FDR) method. The innovation of this procedure is that it controls the expected proportion of false positives only among those tests for which a local significance has been detected. The FDR method thus allows an expected proportion (usually 5%) of the FDR corrected significance values to be falsely positive. The correction using FDR provides an interpretable and adaptive criterion with higher power than the non-parametric permutation tests. FDR thus results in a less conservative estimate of the false-negatives.
Hotelling T^2 metric
For the case group mean difference testing of balanced groups that are well controlled, our original testing framework is of best use. Here we compute locally the standard robust Hotelling T^2 two sample metric, then estimate p-values via standard permutation tests and correct for multiple comparison via FDR and permutation tests of the p-value extrema distributions.
GLM & MANCOVA
In case that correlation statistics are needed, or for the case of unbalanced or not well controlled groups, the novel GLM & MANCOVA statistical framework should be employed. This method first computes a Generalized Linear Model (GLM), followed by a MANCOVA analysis and p-value computation and correction via the same permutation approach mentioned above. The main MANCOVA metric is the Hotelling Trace, but other standard MANCOVA metrics can be used (such as Ray's Max Lambda). In addition to the permutation based p-values, F-test based significance maps are generated. The MANCOVA based testing framework also contains facilities for z-score testing and correlation testing.
Key Investigators
- UNC Algorithms: Martin Styner, Ipek Oguz, Marc Niethammer, Marc Macenko, Beatriz Paniagua, Christine Shun Xu, Hongtu Zhu, Corentin Hamel
- Utah Algorithms: Guido Gerig
Publications
Links
- Main SPHARM shape analysis framework
- ITK statistical analysis using non-parametric permutation analysis and false discovery rate
- NITRC page for SPHARM PDM toolbox
- NITRC page for Shape analysis via GLM & MANCOVA
Project Week Results: Jun 2006
