Projects:DTIPopulationAnalysis
Back to NA-MIC_Collaborations, UNC Algorithms
DTI Population Analysis
Our methodology for population analysis of DT-MRI is based on unbiased non-rigid registration of a population to a common coordinate system. The registration jointly produces an average DTI atlas, which is unbiased with respect to the choice of a template image, along with diffeomorphic correspondence between each image. The registration image match metric uses a feature detector for thin fiber structures of white matter, and interpolation and averaging of diffusion tensors use the Riemannian symmetric space framework. The anatomically significant correspondence provides a basis for comparison of tensor features and fiber tract geometry in clinical studies.
Description
Our registration procedure is based on a scalar feature image which is sensitive to sheet like structures. We have observed that the major fiber bundles of interest occur as sheet or tube like manifolds in the FA image of the brain. As a feature image we use the maximum eigenvalue of the hessian of the FA image. Images are initially aligned using an affine registration and then deformed to a common coordinate system using the unbiased atlas-building procedure of Joshi et al. [1]. The deformation fields produced by the registration process are applied to the tensors fields using appropriate methods for reorienting and interpolating tensors. The transformed images are averaged in the atlas space to produce a DTI atlas.
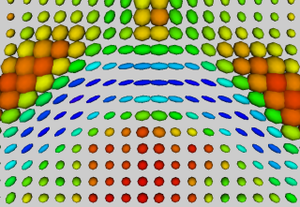
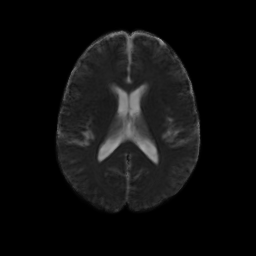
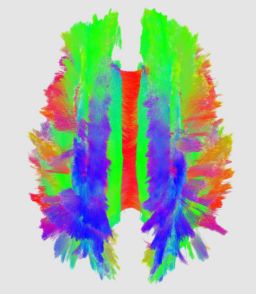
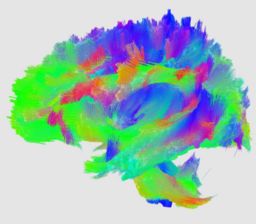
An initial test was performed by using the procedure on a set of images of healthy subject at age one year. The results of the tensor averaging are shown on the right. Tractography was also performed on the mean atlas image as shown.
Collaboration with PNL
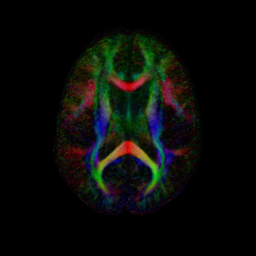
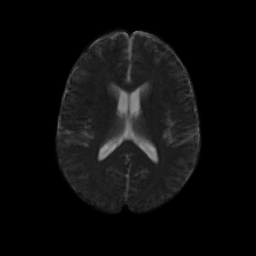
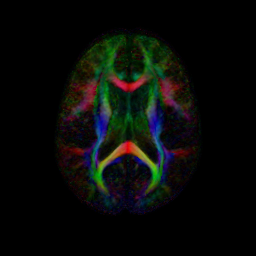
We have begun to apply the DTI atlas building procedure to data provided by the PNL. A combined set of DTI scans from control and Schizophrenic subjects were aligned using the procedure described above. In the atlas space the SZ and CNTL groups are processed to produce voxel-wise statistics for each group. The figure below shows colored FA and mean diffusivity slices for both the CNTL and SZ group. Preliminary work is now being done on region of interest (ROI) hypothesis testing between the two populations.
Publications
Key Investigators
Casey Goodlett, Guido Gerig

