NA
From NAMIC Wiki
Home < NA
Back to NA-MIC_Collaborations
Objective: We are developing a software infrastructure within ITK for DTI analysis. This includes algorithms for statistical analysis of diffusion tensors, fiber tractography, image filtering and registration.
Progress:
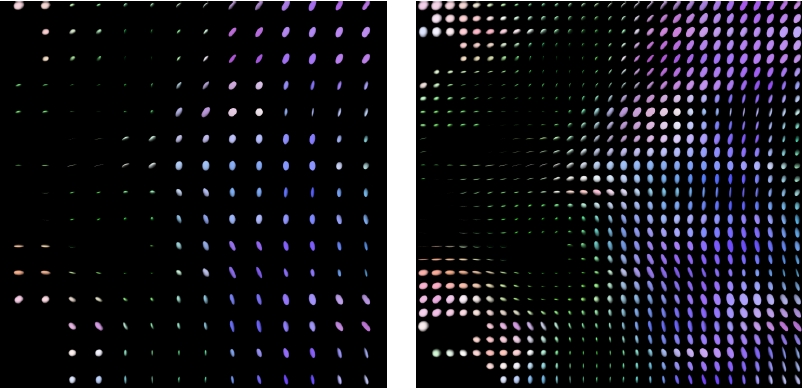
- Geometric tools for diffusion tensor analysis. We have built a framework for geometric computations on tensors. This includes vector space operations on tensors as well as nonlinear operations that preserve the positive eigenvalues of the tensors. These geometric methods are the foundation for many of the tools below.
- Statistical tools for diffusion tensor analysis. We have implemented methods for computing averages, covariances, and statistical group comparisons of diffusion tensor data.
- Fiber tractography. We have developed software for tracking and viewing white matter fiber tracts. This tool has been combined with the statistical methods above for analysis and group comparisons of diffusion tensor data along white matter tracts.
- Diffusion Tensor image filtering. We are building a framework within ITK for filtering diffusion tensor images. This includes several methods from the literature and both methods that filter estimated tensor fields and those that filter the original diffusion weighted data.
- Diffusion Tensor image registration. We are building a framework within ITK for registration of diffusion tensor images. This requires image match metrics, interpolation of tensor images, and tensor image transformations.
Reference: Corouge, I., Fletcher, P.T., Joshi, S., Gilmore, J.H., Gerig, G. Fiber Tract-Oriented Statistics for Quantitative Diffusion Tensor MRI Analysis, presented at MICCAI 2005.
Key Investigators:
- Utah: Tom Fletcher, Ross Whitaker
- UNC: Isabelle Corouge, Casey Goodlett, Guido Gerig
- GE: Jim Miller
Links:
Representative Image and Descriptive Caption:
