Projects:DTI DWI QualityControl
Back to UNC Algorithms
Diffusion Tensor and Diffusion Weighted Imaging Quality Control

As theoretical work characterizing DTI grows, it is essential to increase its practical usability from a clinical environment perspective. Inherently, DWI images suffer from a vast variety of artifacts and the acquisition time for diffusion MRI is longer than conventional MRI due to the need for multiple acquisitions to obtain directionally encoded Diffusion Weighted Images (DWI). This leads to increased motion artifacts and reduced signal-to-noise ratio (SNR). Therefore, in a clinical environment, this imaging technique needs additional processes such as appropriate QC assessment methods to increase its practical usability. We are developing a framework, called DTIPrep, for assessing and correcting DWIs and DTI.
Description
Current framework for DWI QC
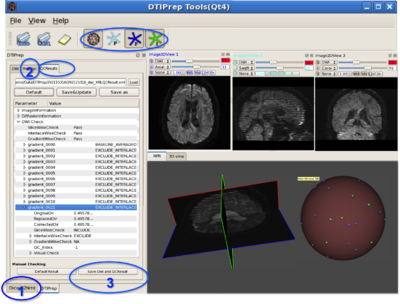
DTIPrep is the first comprehensive and fully automatic pre-processing tool for DWI and DTI quality control can provide a crucial piece for robust DTI analysis studies. The protocoling, reporting, visual controlling and data correction capabilities are used to produce high consistence and inter-rater reliable QC results. This framework is organized by pipeline steps include: 1) Dicom to NRRD converting, 2) image info checking, 3) diffusion information checking, 4) rician LMMSE noise filter, 5) slice-wise intensity checking, 6) interlace-wise intensity checking, 7) Averaging baseline images, 8) Eddy current and motion correction, 9) gradient-wise checking of residual motion/deformations, 10) joint rician LMMSE noise filter, 11) brain masking, 12) DTI computing, 13) dominant direction artifact (vibration artifact) checking, 14) optional visual checking and 15) simulation-based bias analysis.
Entropy Based Diffusion Imaging Quality Control
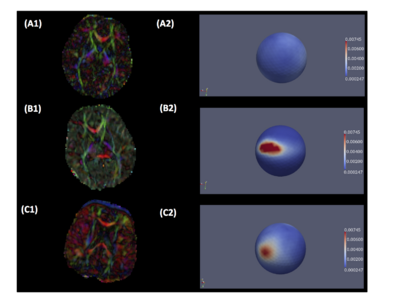
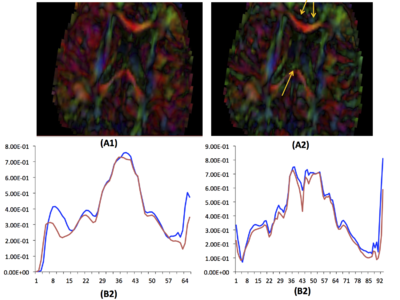
We have proposed new QC step for detecting drop-out signal intensities which can be caused by mechanical vibration artifacts. This step detects and potentially removes these residual artifacts that are not commonly detected in the individual DWIs. The artifacts appear in color-FA images in either widespread or local dominant direction ( see Fig?? ). In order to detect such artifacts, we proposed a new approach via the entropy of the Principal Direction (PD) histogram computed over the major region of the image (e.g. the full brain). Given a prior knowledge of expected entropy values for acceptable scans, the quality of the DTI image is categorized into acceptable, suspicious and highly suspicious/rejection categories using calculated the standard scores.

For our correction step, we employed a simple, iterative leave-one-out-strategy over all individual DWI images by recomputing DTI images and correspond- ing entropies. At each iteration, the DWI with maximal improvement is removed and all leave-one-out entropies are recomputed. This process is continued until either the z-score is in acceptable range or a maximum threshold for exclusion is reached.
Publications
Key Investigators
- UNC Algorithms: Mahshid Farzinfar, Zhexing Liu, Martin Styner, Clement Vachet
- Utah Algorithms: Tom Fletcher, Ross Whitaker, Guido Gerig, Sylvain Gouttard
Links
- DTIPrep on NITRC

