Collaboration/UIowa/Developing Electronic Atlas Software using NA-MIC Kit
 Return to Project Week Main Page |
Key Investigators
- Gary Christensen, Iowa
- Joo Hyun (Paul) Song, Iowa
- Jake Nickel, Iowa
- Nick Kiguta, Iowa
- Sandy Wells, BWH
- ?Stephen Aylward, Kitware
Objective
Develop a software tool for visualizing and querying an electronic atlas. We are developing atlases of the human lung R01 HL64368, the rat lung R01HL073598, and the mouse lung R01 HL080285. We want to make a common software tool that can be customized for specific atlases. The image data and semantic information will be stored in a database and will be indexed through a graphical user interface.
Approach, Plan
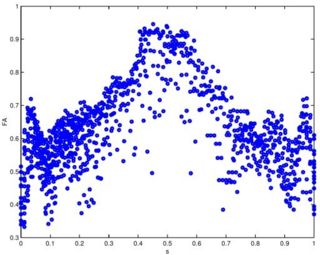
Our approach for analyzing diffusion tensors is summarized in the IPMI 2007 reference below. The main challenge to this approach is <foo>.
first try out <bar>,...
Have done an initial design of the desired system.
Our plan for the project week is to
- Learn how to interface NA-MIC tools with database tools such as MySQL
- Learn how to make a GUI for the atlas
- Learn how to render 2D and 3D images using the NA-MIC software
- Learn how to interact with 2D and 3D images by clicking on the images
- Learn how to read, organize, and visualize images, surface models, segmentations and symbolic information referenced by coordinate systems using the NA-MIC software
The database should contain the following information, plus additional information, for every region on the atlas:
- statistics – average length, width, surface area, etc.
- labels – floating labels above the atlas that is visible from all viewing angles.
- associated color – the associated color that marks particular regions on the atlas.
- description – detailed description of the region on the atlas.
Clicking on either the 2D or the 3D image should respond in the following manner:
- Highlight and display the corresponding region for all viewing windows.
- Query the database for the selected point, pull up every relevant information about the location and display.
When dealing with registration images, clicking on the template/target image should highlight and display the corresponding point on a transformed coordinate system.
Progress
Software for the fiber tracking and statistical analysis along the tracts has been implemented. The statistical methods for diffusion tensors are implemented as ITK code as part of the DTI Software Infrastructure project. The methods have been validated on a repeated scan of a healthy individual. This work has been published as a conference paper (MICCAI 2005) and a journal version (MEDIA 2006). Our recent IPMI 2007 paper includes a nonparametric regression method for analyzing data along a fiber tract.

