Collaboration/UIowa/Developing Electronic Atlas Software using NA-MIC Kit
 Return to Project Week Main Page |
Key Investigators
- Gary Christensen, Iowa
- Joo Hyun (Paul) Song, Iowa
- Jake Nickel, Iowa
- Nick Kiguta, Iowa
- Jeff Grethe, UCSD
- Wendy Plesniak, BWH
- Raul San Jose, BWH
- Curtis Lisle, Isomics
- Will Schroeder, Kitware
Objective
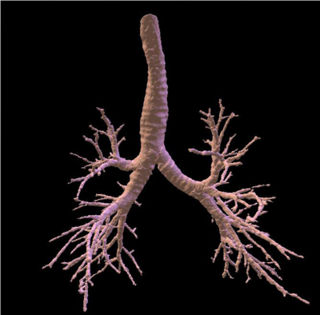
Develop a software tool for visualizing and querying an electronic atlas. We are developing atlases of the human lung R01 HL64368, the rat lung R01HL073598, and the mouse lung R01 HL080285. We want to make a common software tool that can be customized for specific atlases. The image data and semantic information will be stored in a database and will be indexed through a graphical user interface.
Approach, Plan
Our plan for the project week is to
- Learn how to interface NA-MIC tools with database tools such as MySQL
- Learn how to make a GUI for the atlas
- Learn how to render 2D and 3D images using the NA-MIC software
- Learn how to interact with 2D and 3D images by clicking on the images
- Learn how to read, organize, and visualize images, surface models, segmentations and symbolic information referenced by coordinate systems using the NA-MIC software
The database should contain the following information, plus additional information, for every region on the atlas:
- statistics – average length, width, surface area, etc.
- labels – floating labels above the atlas that is visible from all viewing angles.
- associated color – the associated color that marks particular regions on the atlas.
- description – detailed description of the region on the atlas.
Clicking on either the 2D or the 3D image should respond in the following manner:
- Highlight and display the corresponding region for all viewing windows.
- Query the database for the selected point, pull up every relevant information about the location and display.
When dealing with registration images, clicking on the template/target image should highlight and display the corresponding point on a transformed coordinate system.
Progress
- Learned about the functionalities of CMake.
- Learned about the features of Subversion revision control system.
- Learned about Dart and the nightly builds.
- Adopted the itkImageToVTKImageFilter to display Analyze-format images in VTK.
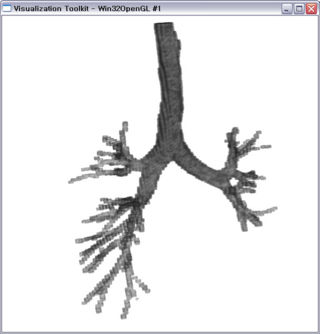
- Rendered Analyze image volumes with 3D volume renderer in VTK.
- Converted Analyze-format images to VTK image volumes and surfaces.
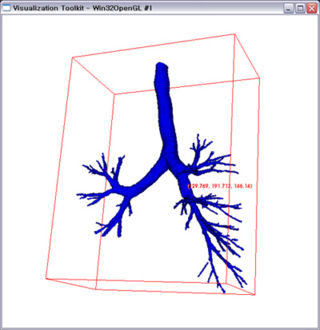
- Rendered VTK image volumes with 3D surface renderer in VTK.
- Picked points on the 3D rendered surface and got the corresponding 3D coordinates.
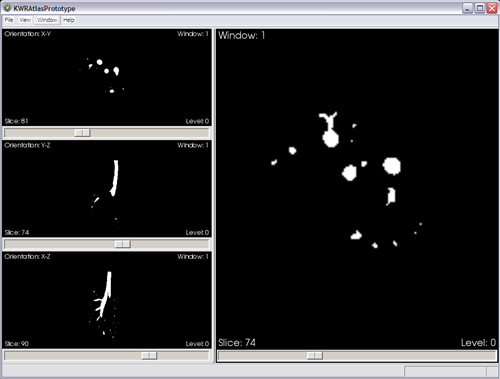
- Developing a GUI for the Atlas that features the 3 orthogonal views of the image volume and 3D renderings.
 Geek Philosophy [Source: http://www.thinkgeek.com] |
References
This work is supported in part by NIH grants HL64368, HL080285, HL073598, and EB004126.

