July31T-con/PlayingWithTheDiffusionData
Exploring the Upsampling of the BWH Diffusion Data
Extracting one a slice for one of the gradient directions of the diffusion data results in an image like this:
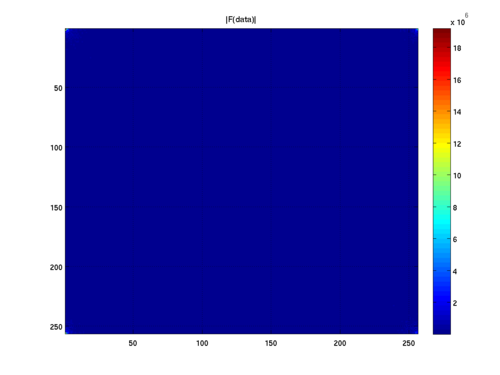
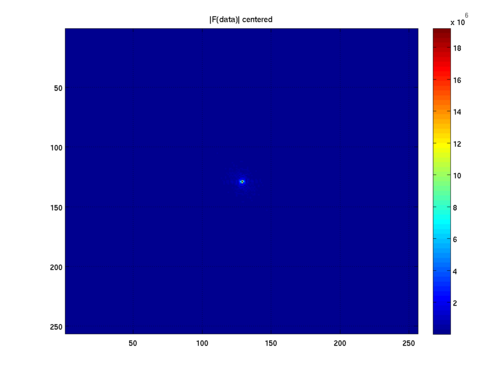
A two-dimensional Fourier transform leads the following magnitude images (uncentered and centered):
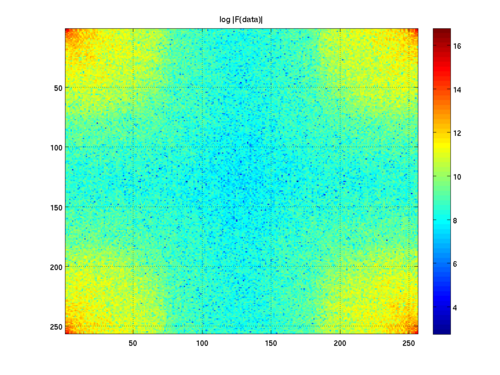
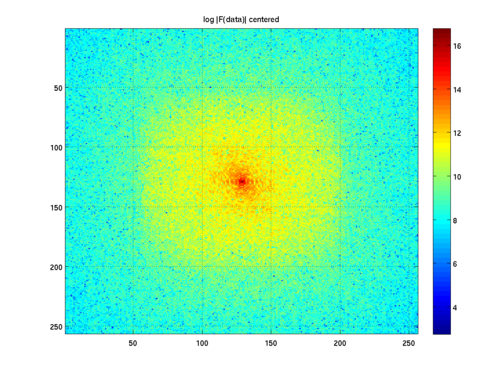
Representing this in the log-domain results in
Unfortunately, we don't see nice blue regions that we would have expected from ideal zero-padding. Instead it looks a little "salt-and-peppery." Is this a scanner discretization effect?
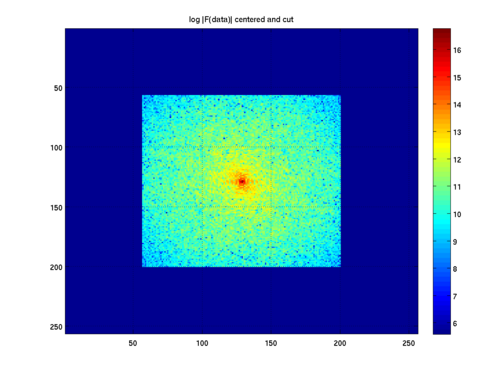
Cutting away everything that should ideally be zero gives this Fourier log-image:
An inverse Fourier transform followed by discretization results in:
The result is slighly smoother than the original, which is sensible since we essentially low-pass filtered the result.
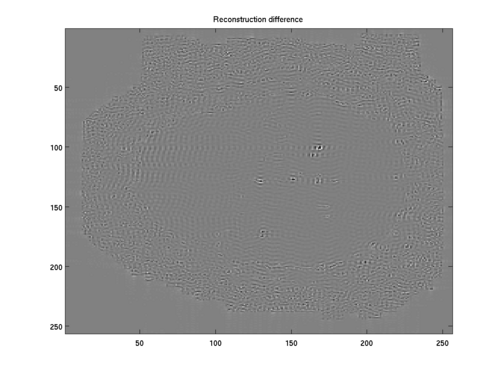
The difference between original and reconstruction is not great, but still shows a little bit of structure:
In case you want to recreate the results. Here is the matlab script dwiTstScript.m. And here is the data SampleDWIDataSlice.tar.gz.

