Algorithm:UNC:Shape Analysis
Contents
Description
Shape analysis has become of increasing relevance to the neuroimaging community due to its potential to precisely locate morphological changes between healthy and pathological structures. This project focuses on developing novel methodology and a comprehensive set of tools for the computation of 3D structural statistical shape analysis. There are several open problems in this area, ranging from multi-object analysis, enhanced shape correspondence to statistical analysis of shape with clinical covariates. We at UNC have developed and implemented an ITK-based framework for local shape analysis. Several projects handle specific visualizations, correspondence establishing methodology and sophisticated statistics. All of these projects have a generic component that make relevant in other applications (e.g. the statistical methods can be applied to other settings in need of multiple comparison correction, such as when many volumetric measurements are analyzed jointly).
SPHARM-PDM
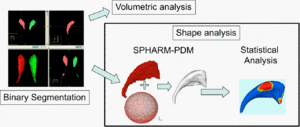
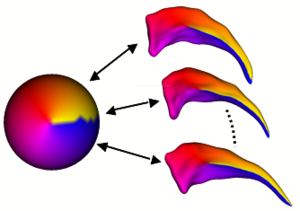
The UNC shape analysis is based on an analysis framework of objects with spherical topology, described by sampled spherical harmonics SPHARM-PDM. In summary, the input of the proposed shape analysis is a set of binary segmentation of a single brain structure, such as the hippocampus or caudate. These segmentations are first processed to fill any interior holes and a minimal smoothing operation. The processed binary segmentations are converted to surface meshes, and a spherical parametrization is computed for the surface meshes using a area-preserving, distortion minimizing spherical mapping. The SPHARM description is computed from the mesh and its spherical parametrization. Using the first order ellipsoid from the spherical harmonic coefficients, the spherical parametrizations are aligned to establish correspondence across all surfaces. The SPHARM description is then sampled into a triangulated surfaces (SPHARM-PDM) via icosahedron subdivision of the spherical parametrization. These SPHARM-PDM surfaces are all spatially aligned using rigid Procrustes alignment. Group differences between groups of surfaces are computed using the standard robust Hotelling T 2 two sample metric (see below). Statistical p-values, both raw and corrected for multiple comparisons, result in significance maps. Additional visualization of the group tests are provided via mean difference magnitude and vector maps, as well as maps of the group covariance information.
The implementation has reached a stable framework and has been disseminated to several collaborating labs within NAMIC (BWH, GeorgiaTech, Utah). The current development focuses on integrating the current command line tools into the Slicer (v3) via the Slicer execution model.
Correspondence
The SPHARM-PDM based correspondence is a global correspondence method that does performs well for many structures. But in our studies it has shown to be inferior to population based correspondence methods, when assessing statistical modeling properties derived from the established correspondence, such as specificity and generalization ability of a statistical model. Current methodology in population based correspondence is based mainly on minimizing distribution properties of surface point locations and are thus not invariant to alignment. We have extended the population based correspondence framework to include curvature based measurements, such as the Koenderink Shape Index S and Curvedness C in combination with the standard location information. The implementation is based on ITK and uses the SPHARM-PDM correspondence as an initialization. We have favorably compared our combined "Curvature + Location" MDL to the standard MDL, as well as to the SPHARM approach. Especially with more complex structures, such as the femural bone and the striatal structure (composed of caudate, nucleus accumbens and putamen), our method outperforms the other methods. It also illustrates the potential of this approach of objects as complex as the human cortex, the object of study in the NAMIC year 07/08.
Statistics
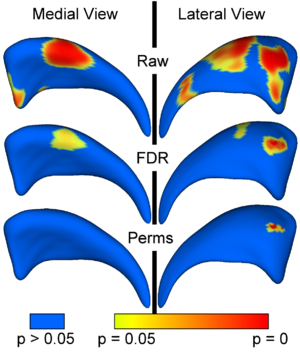
In our statistical framework, group differences between groups of surfaces are computed locally for every surface point using the standard robust Hotelling T^2 two sample metric. Statistical p-values, both raw and corrected for multiple comparisons, result in significance maps. Additional visualization of the group tests are provided via mean difference magnitude and vector maps, as well as maps of the group covariance information.
The local shape analysis involves testing from a few to many thousands of hypothesis (one per surface ele- ment) for statistically significant effects. It is thus important to control for the multiple testing problem, and the most common measure of multiple false positives is the familywise error rate (FWER). The multiple testing problem has been an active area of research in the functional neuroimaging community. One of the widely used methods in the analysis of neuroimaging data makes inferences based on the maximum distribution. In our work, we are employing non-parametric permutation tests to estimate uniformly sensitive extrema distributions. The correction method is based on computing first the local p-values using permutation tests. The minimum of these p-values across the surface is then computed for every permutation. The appropriate corrected p-value at level α can then be obtained by the computing the value at the α-quantile in the histogram of these minimum values. Using the minimum statistic of the p-values, this method correctly controls for the FWER, or the false positives, but no control of the false negatives is provided. The resulting corrected local significance values can thus be regarded as pessimistic estimates akin to a simple Bonferroni correctection.
Additionally to the non-parametric permutation correction, we have also implemented and applied a False Discovery Rate Estimation (FDR) method. The innovation of this procedure is that it controls the expected proportion of false positives only among those tests for which a local significance has been detected. The FDR method thus allows an expected proportion (usually 5%) of the FDR corrected significance values to be falsely positive. The correction using FDR provides an interpretable and adaptive criterion with higher power than the non-parametric permutation tests. FDR thus results in a less conservative estimate of the false-negatives.
Current development is extending the framework to include subject variables, such as gender, age and clinical scores into the current pure group difference computation.
Slicer integration
A considerable amount of work was spent on the development aspect of our shape analysis tools. The main visualization tool, KWMeshVisu, can be called directly from Slicer 3 for the overlay of scalar, vector and ellipsoid data onto surfaces (so-called attribution) and the application of a set of versatile colormaps. The display of a saved "attributed" surfaces is then again possible within Slicer 3 to close the loop. This lean visualization tool fills a niche and is also used in our cortical thickness analysis tool.
The individual shape analysis components have also been integrated into Slicer 3 modules. While it is entirely possible to run all steps of our shape analysis pipeline by calling the individual modules, this is highly inefficient. As a result we are developing, and a first prototype is ready, a separate shape pipeline tool to called from within Slicer3. This tool creates pipeline scripts for Batchmake, another NAMIC supported project at Kitware, to run the shape analysis pipeline as a distributed, background process. The whole shape analysis pipeline thus becomes entirely encapsulated and accessible to the trained clinical collaborator.
Current status
In order to add the UNC shape analysis tools to the current 3D Slicer distribution do the following: a) Download the distribution from http://www.ia.unc.edu/dev/download/shapeAnalysis/ (only linux 32 and 64 bit) b) Copy all the executables to a folder with Slicer plugins or add the executable folder to the module path in Slicer (View->Application Settings->Module Settings) d) start Slicer e) all individual steps can be run now without problem (they are listed under the Shape Analysis category) f) in order to run the comprehensive ShapeAnalysis tool (which is the recommended way to do this), one needs to run the following thing: Slicer3 --exec KWShapeAnalysisTool This last step is a current work around, which will be corrected this summer. While one can see the KWShapeAnalysis module (under the UNC category), it will not work unless started as described above.
Software
- SPHARM-PDM based framework for shape analysis Binary Download, also available via CVS open source access
- MDL based correspondence improvement available via CVS open source access
Publications
- Styner M, Xu SC, El-Sayed M, Gerig G, Correspondence Evaluation in Local Shape Analysis and Structural Subdivision, IEEE Symposium on Biomedical Imaging ISBI 2007, in print
- Zhou C, Park DC, Styner M, Wang YM, ROI Constrained Statistical Surface Morphometry, IEEE Symposium on Biomedical Imaging ISBI 2007, in print
- Nain D, Styner M, Niethammer M, Levitt JJ, Shenton ME, Gerig G, Bobick A, Tannenbaum A, Statistical Shape Analysis of Brain Structures Using Spherical Wavelets, IEEE Symposium on Biomedical Imaging ISBI 2007, in print
- M. Styner, I. Oguz, S. Xu, D. Pantazis, and G. Gerig. Statistical group differences in anatomical shape analysis using hotelling T2 metric. Proc SPIE Medical Imaging Conference, in print, 2007.
- C Cascio, M Styner, RG Smith, M Poe, G Gerig, H Hazlett, M Jomier, R Bammer, J Piven, Reduced relationship to cortical white matter revealed by tractography-based segmentation of the corpus callosum in yound children with developmental delay, Am J Psychiatry, 2006, (163) 2157-2163, December.
- M. Styner, I. Oguz, S. Xu, C. Brechbuehler, D. Pantazis, J. Levitt, M. Shenton, G. Gerig. Framework for the Statistical Shape Analysis of Brain Structures using SPHARM-PDM. MICCAI 2006 Open Source Workshop. Insight Journal DSpace link: http://hdl.handle.net/1926/215
- I. Oguz, G. Gerig, S. Barre, M. Styner. KWMeshVisu: A Mesh Visualization Tool for Shape Analysis. MICCAI 2006 Open Source Workshop. Insight Journal DSpace link: http://hdl.handle.net/1926/220
- Tobias Heimann, I. Oguz, I. Wolf, M. Styner, HP. Meinzer. Implementing the Automatic Generation of 3D Statistical Shape Models with ITK. MICCAI 2006 Open Source Workshop. Insight Journal DSpace link: http://hdl.handle.net/1926/224
- C Cascio, M. Styner, R. Smith, M. Poe, G. Gerig, H. Hazlett, M. Jomier, R. Bammer, J. Piven: Tractography based segmentation of the corpus callosum reveals reduced callosal size and correlation with cortical white matter in young children with developmental delay, American Journal of Psychiatry, 2006, in press
- M. Styner, M. Jomier, G. Gerig: Closed and Open Source Neuroimage Analysis Tools and Libraries at UNC: IEEE Symposium on Biomedical Imaging ISBI 2006, pp. 702-705.
- S. Olmos, M. Bossa, M. Styner: PCA-based filtering for hypothesis testing on hippocampus shape differences between schizophrenics and normals. Medical Image Understanding and Analysis 2005, Bristol, pp. 167-170.
- M Styner, JA Lieberman, RK McClure, DR Weingberger, DW Jones, G Gerig: Morphometric analysis of lateral ventricles in schizophrenia and healthy controls regarding genetic and disease-specific factors, Proceedings of the National Academy of Science, 2005, Vol 102, No. 12, March 29, p 4872-4877.
- D. Pantazis, R.M. Leahy, T.E.Nichols, M. Styner: Statistical Surface Based Morphometry Using a Non-Parametric Approach, IEEE Symposium on Biomedical Imaging ISBI 2004,1283-1286.
- M. Styner, J.A. Lieberman, D. Pantazis, G. Gerig: Boundary and Medial Shape Analysis of the Hippocampus in Schizophrenia, Medical Image Analysis, 2004, pp 197-203.
- S.Vetsa, M. Styner, S. Pizer, J. Lieberman, G. Gerig: Caudate shape discrimination in schizophrenia using template-free non-parametric tests, Medical Image Computing and Computer-Assisted Intervention MICCAI 2003, pp.661-669
- M. Styner, J. Lieberman, G. Gerig: Boundary and Medial Shape Analysis of the Hippocampus in Schizophrenia, Medical Image Computing and Computer-Assisted Intervention MICCAI 2003, II, pp. 464-471.
- G. Gerig, K. Muller, E. Kistner, Y. Chi, M. Chakos, M. Styner, J. Lieberman: Age and treatment related local hippocampal changes in schizophrenia explained by a novel shape analysis method, Medical Image Computing and Computer-Assisted Intervention MICCAI 2003, II, pp. 651-660.
- M. Styner, G. Gerig, J. Lieberman, D. Jones, D. Weinberger: Statistical shape analysis of neuroanatomical structures based on medial models, Medical Image Analysis, 7 (3), 2003, pp. 207-220.


