Projects:dtistatisticsfibers
Statistics on DTI data
Back to NA-MIC Collaborations, Utah2 Algorithms, MIT Algorithms, UNC Algorithms
DTI Fiber Tract statistics
Following the complete pipeline using Casey Goodlett's work, we get the fiber files containing DTI data. (The pipeline includes unbiased non-rigid registration of a population, Fiber tractography applied to the average atlas, and finding individual subjects' DTI data by mapping the atlas geometry back to individual subjects.
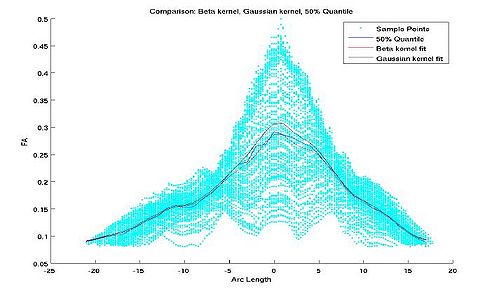
We are working on a command line tool which takes as input the fiber files generated by the above pipeline. The tool has options to perform kernel based regression on the DTI data (like FA, MD, FRO, AD, RD etc). Each kernel window assumes a noise model within the given cross section of the fiber and then chooses a statistic to represent the information in that window. Currently, the tool implements Gaussian and Beta (only for FA) noise models for data within fiber cross sections. The [possible statistics that can be chosen are Mean, Mode and Quantiles. The tool also computes the standard deviations about the regressed curve. The output is saved as a file. All the results can be plotted using Matlab scripts.
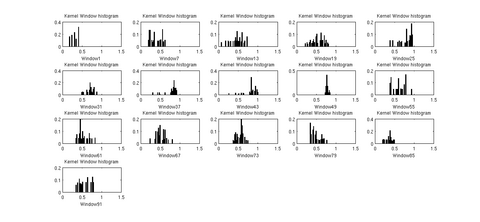
There are various visualization options available like viewing the data distribution histograms within cross sections (before and after applying the kernels), scatter plots to view the actual distribution of the DTI data, and more. These options will help in further analyzing the best noise models and the best representative statistrics to explain the distributioin of DTi data along the fiber tract.
The tool will replace the command line interface that Fiber Viewer tool currently provides to do simialr (though very limited) tasks.We are currently testing the results of the tool on data from neonates, 1 year and 2 year old subjects. Casey's Functional Data Analysis module is also being used to analyze the results generated above.


