NAMIC Wiki:DTI:TeemExamples
The goal of this page is to accumulate helpful usage examples of Teem software used on DWI and DTI data. Teem is now shipping as a component of Slicer 2.6, and can be built via CMake. Compiling Teem results in a number of libraries, as well as a set of command-line tools. The two most useful of these are:
- unu: for general manipulation of raster data
- tend: for handling of DWI and DTI data specifically
For the time being, here are some pre-compiled binaries for different platforms
- http://www.sci.utah.edu/~gk/Deft-0.1.1-Linux-32.tgz : Linux
- http://www.sci.utah.edu/~gk/Deft-0.1.1-Windows.exe : Windows installer
- http://www.sci.utah.edu/~gk/Deft-0.1.1-Mac.dmg : Mac disk image
For both of these tools, you can get a list of available commands just by typing "unu" or "tend", and then get usage info for each command by running the command with no extra options (e.g. "unu slice").
This page also gives a simple demonstration of Deft, a new interactive tensor visualization tool built on top of Teem. Deft's initial reason to exist is to have a fast and convenient way of verifying the correctness of the measurement frame information.
The examples below use the first of the Dartmouth DWI datasets , 01-dwi.nhdr, as a running example of the processing possible.
Contents
- 1 unu minmax: Basic syntax checking
- 2 unu slice, crop, tile: Looking at DWIs on one slice
- 3 unu project, tile: Looking at eddy-current distortion
- 4 tend epireg: fixing eddy-current distortion
- 5 tend estim: tensor estimation
- 6 tend anvol, evecrgb: slice-based data inspection
- 7 tend unmf: applying/removing the measurement frame
unu minmax: Basic syntax checking
unu minmax 01-dwi.nhdr
This will read in the entire volume and print out the range of values:
min: 0
max: 14618
The purpose of this is not to learn the range of values so much as it is to verify that the nrrd software reader can read in the header (and detached data files, if any) without any errors. If there are problems in the NRRD format itself (not the key/value pair DWI convention), you will see them here.
unu slice, crop, tile: Looking at DWIs on one slice
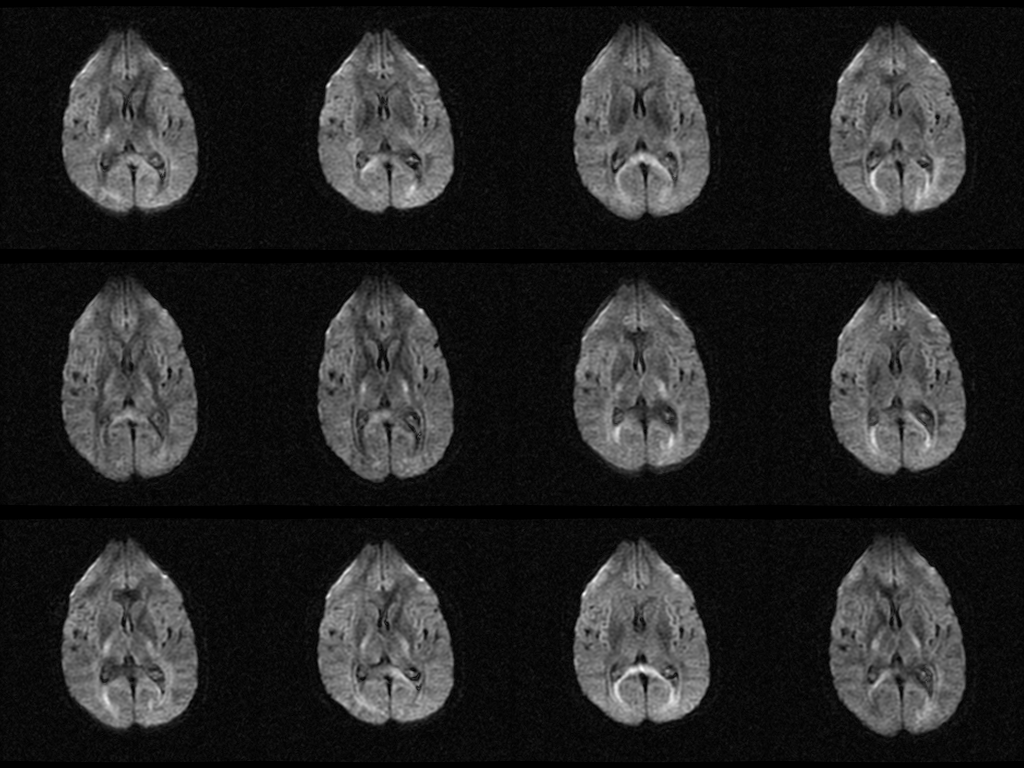
unu slice -i 01-dwi.nhdr -a 2 -p 20 \
 | unu crop -min 0 0 2 -max M M M \
 | unu tile -a 2 0 1 -s 4 3 \
 | unu quantize -b 8 -o 01-dwi-z20.png
This slices along axis 2 (the IS image coordinate) at index 20, crops out the non-DWI baseline images, tiles the 12 DWIs into a 4-by-3 array, quantizes to 8 bits, and save out to a PNG image:
This allows one to verify that axis ordering is right- if the "sizes" field was wrong you would not see coherent images, or they would not show the same anatomical slice shown here.
unu project, tile: Looking at eddy-current distortion
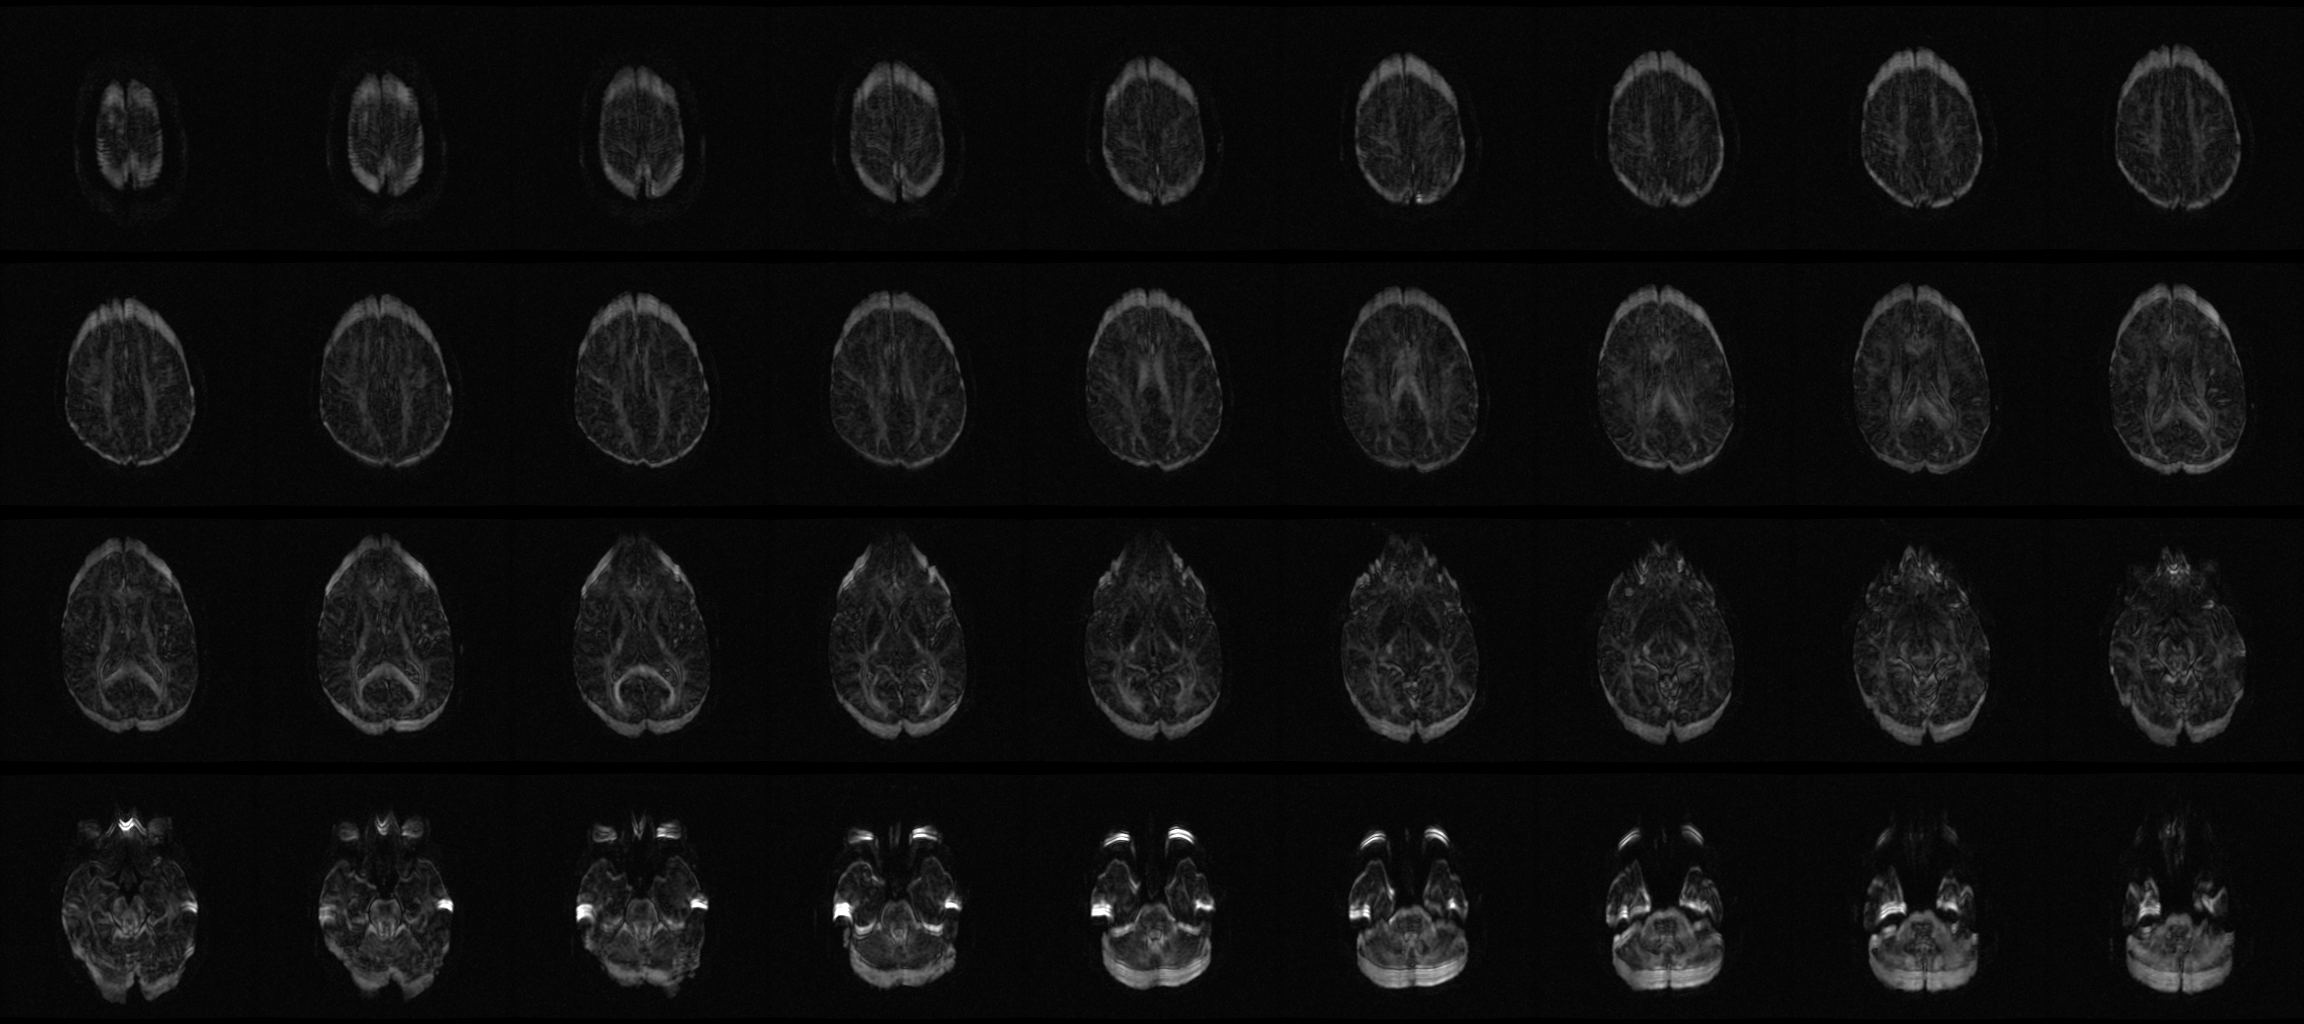
unu crop -i 01-dwi.nhdr -min 0 0 0 2 -max M M M M \
 | unu project -a 3 -m stdv \
 | unu tile -a 2 0 1 -s 9 4 \
 | unu quantize -b 8 -min 0 -max 300 -o 01-dwi-stdv.png
This crops out the B0 images, projects along the DWI images by measuring the standard deviation of the DWI values, tiles to a 9-by-4 image, quantizes and saves to PNG.
The fact that there is a lot of brightness above and below the brain is the sign of mis-registration: variance among the DWI implies anisotropy, and there should not be major anisotropy on the cortical surface.
tend epireg: fixing eddy-current distortion
setenv NRRD_STATE_KEYVALUEPAIRS_PROPAGATE

tend epireg -i 01-dwi.nhdr -g kvp -f 0.65 -o 01-dwireg.nhdr

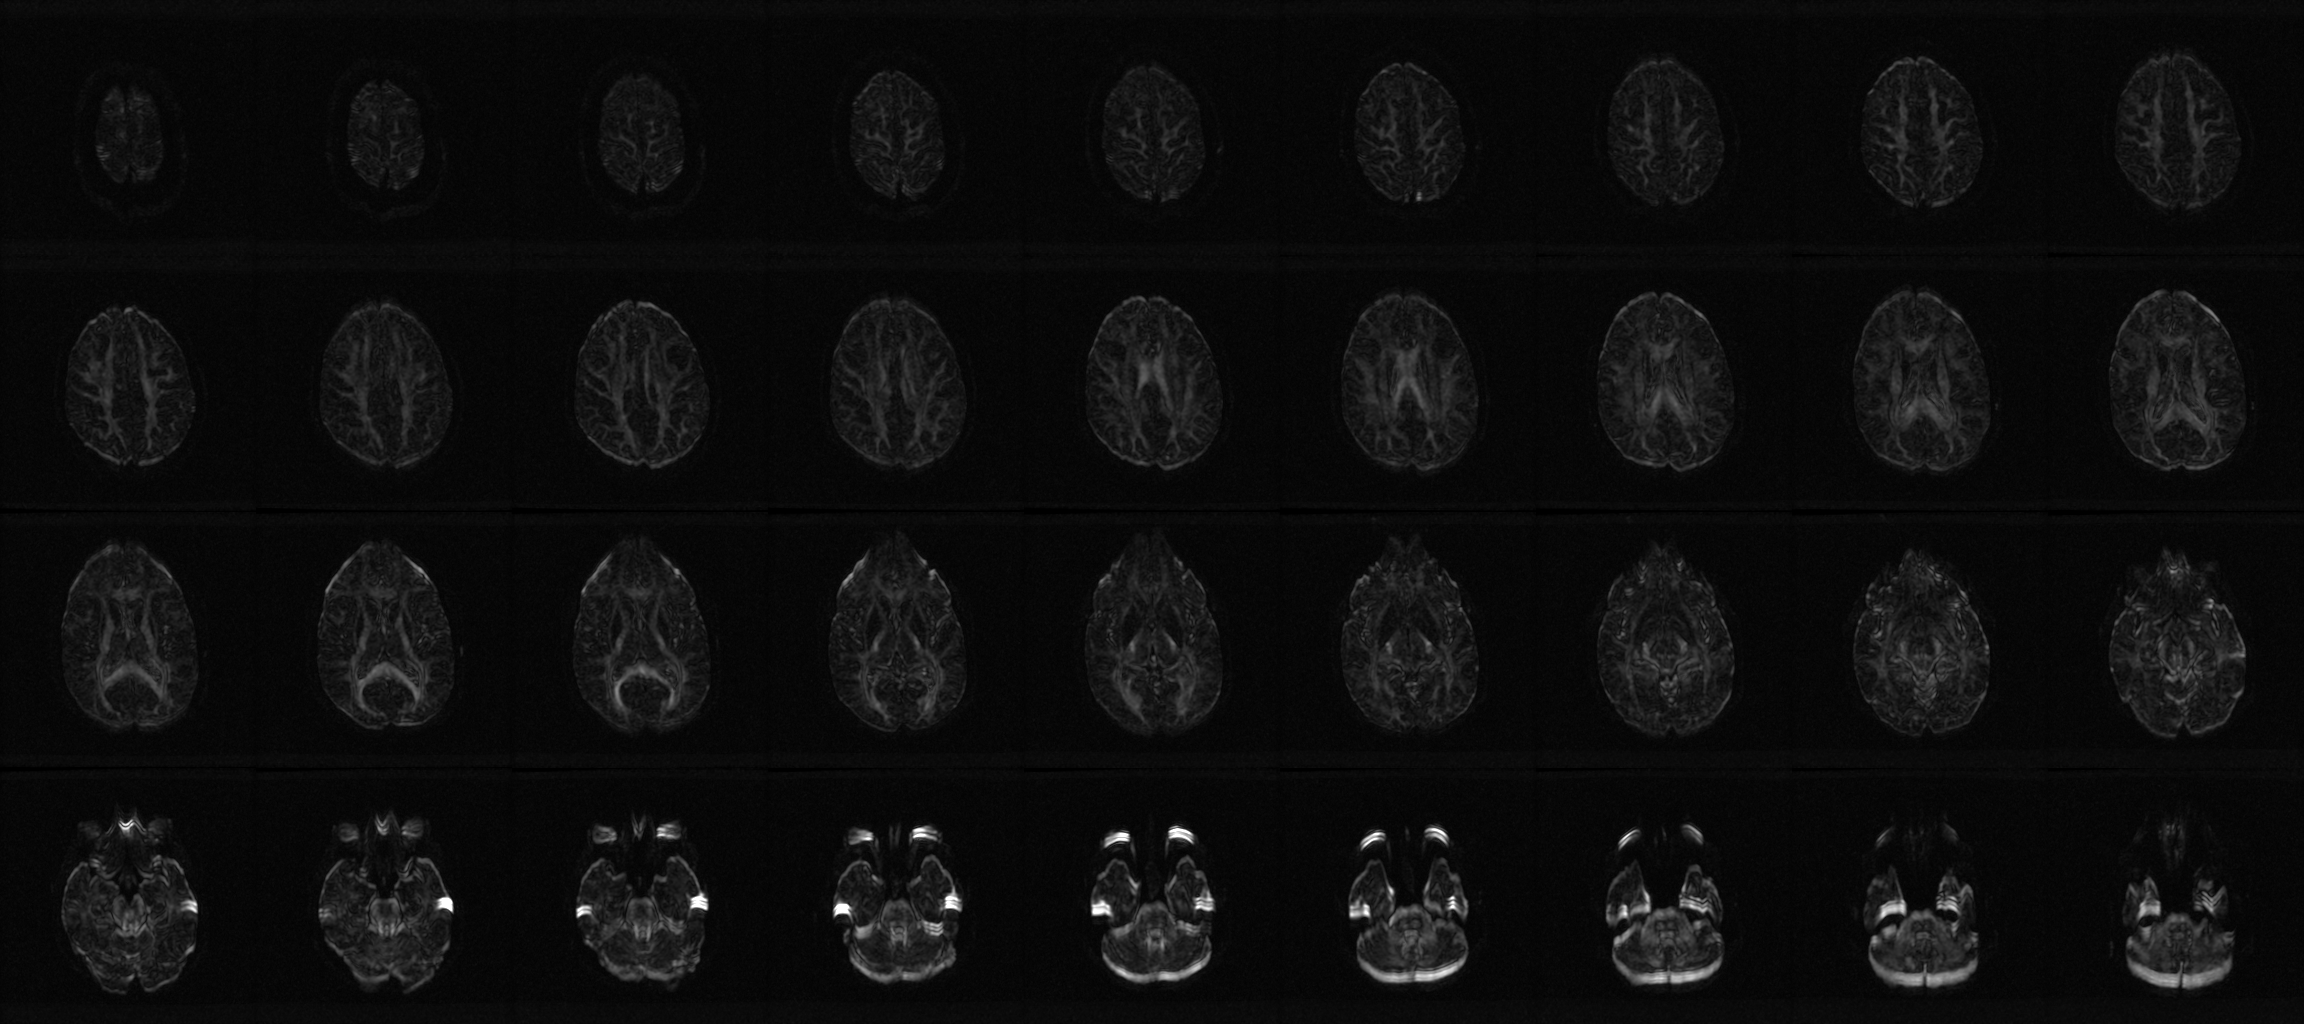
unu crop -i 01-dwireg.nhdr -min 0 0 0 2 -max M M M M \
 | unu project -a 3 -m stdv \
 | unu tile -a 2 0 1 -s 9 4 \
 | unu quantize -b 8 -min 0 -max 300 -o 01-dwireg-stdv.png
This runs a http://www.sci.utah.edu/%7Egk/ismrm04/ on the DWIs, which models the shear/scale/translate distortion along the phase-encode direction as a linear function of the difffusion-sensitizing gradient that is creating the eddy currents that lead to imaging distortion. Then a new DWI stdv image is created like the first. The need to set the NRRD_STATE_KEYVALUEPAIRS_PROPAGATE environment variable is currently a bug, this will be fixed soon.
Like any registration method, the results can be improved by tuning the various parameter settings (type "tend epireg" for all the details); these are just the results from using mainly the defaults.
tend estim: tensor estimation
tend estim -i 01-dwireg.nhdr -B kvp -knownB0 true -o 01-ten.nhdr
By default, this uses linear-least-squares fitting on the log(DWI) to estimate the tensor from the DWIs, with learning all the DWI-specific information from the key/value pairs in the NRRD header ("-B kvp"). The API used by this code (in the "ten" library of Teem) also includes methods for non-linear-least squares and weighted-least-squares, but these are not stable and reliable enough to be advertised at this point.
The way diffusion tensors are represented in NRRD is with 7 values: a mask or confidence value, and then the 6 unique diffusion tensor components. The mask value is determined by a soft-thresholding of an Otsu classification of all the DWI values. This has the effect of masking out the air (because the original T2 is dark), as well as the CSF (its high diffusivity means that it loses all signal with diffusion-weighting).
tend anvol, evecrgb: slice-based data inspection
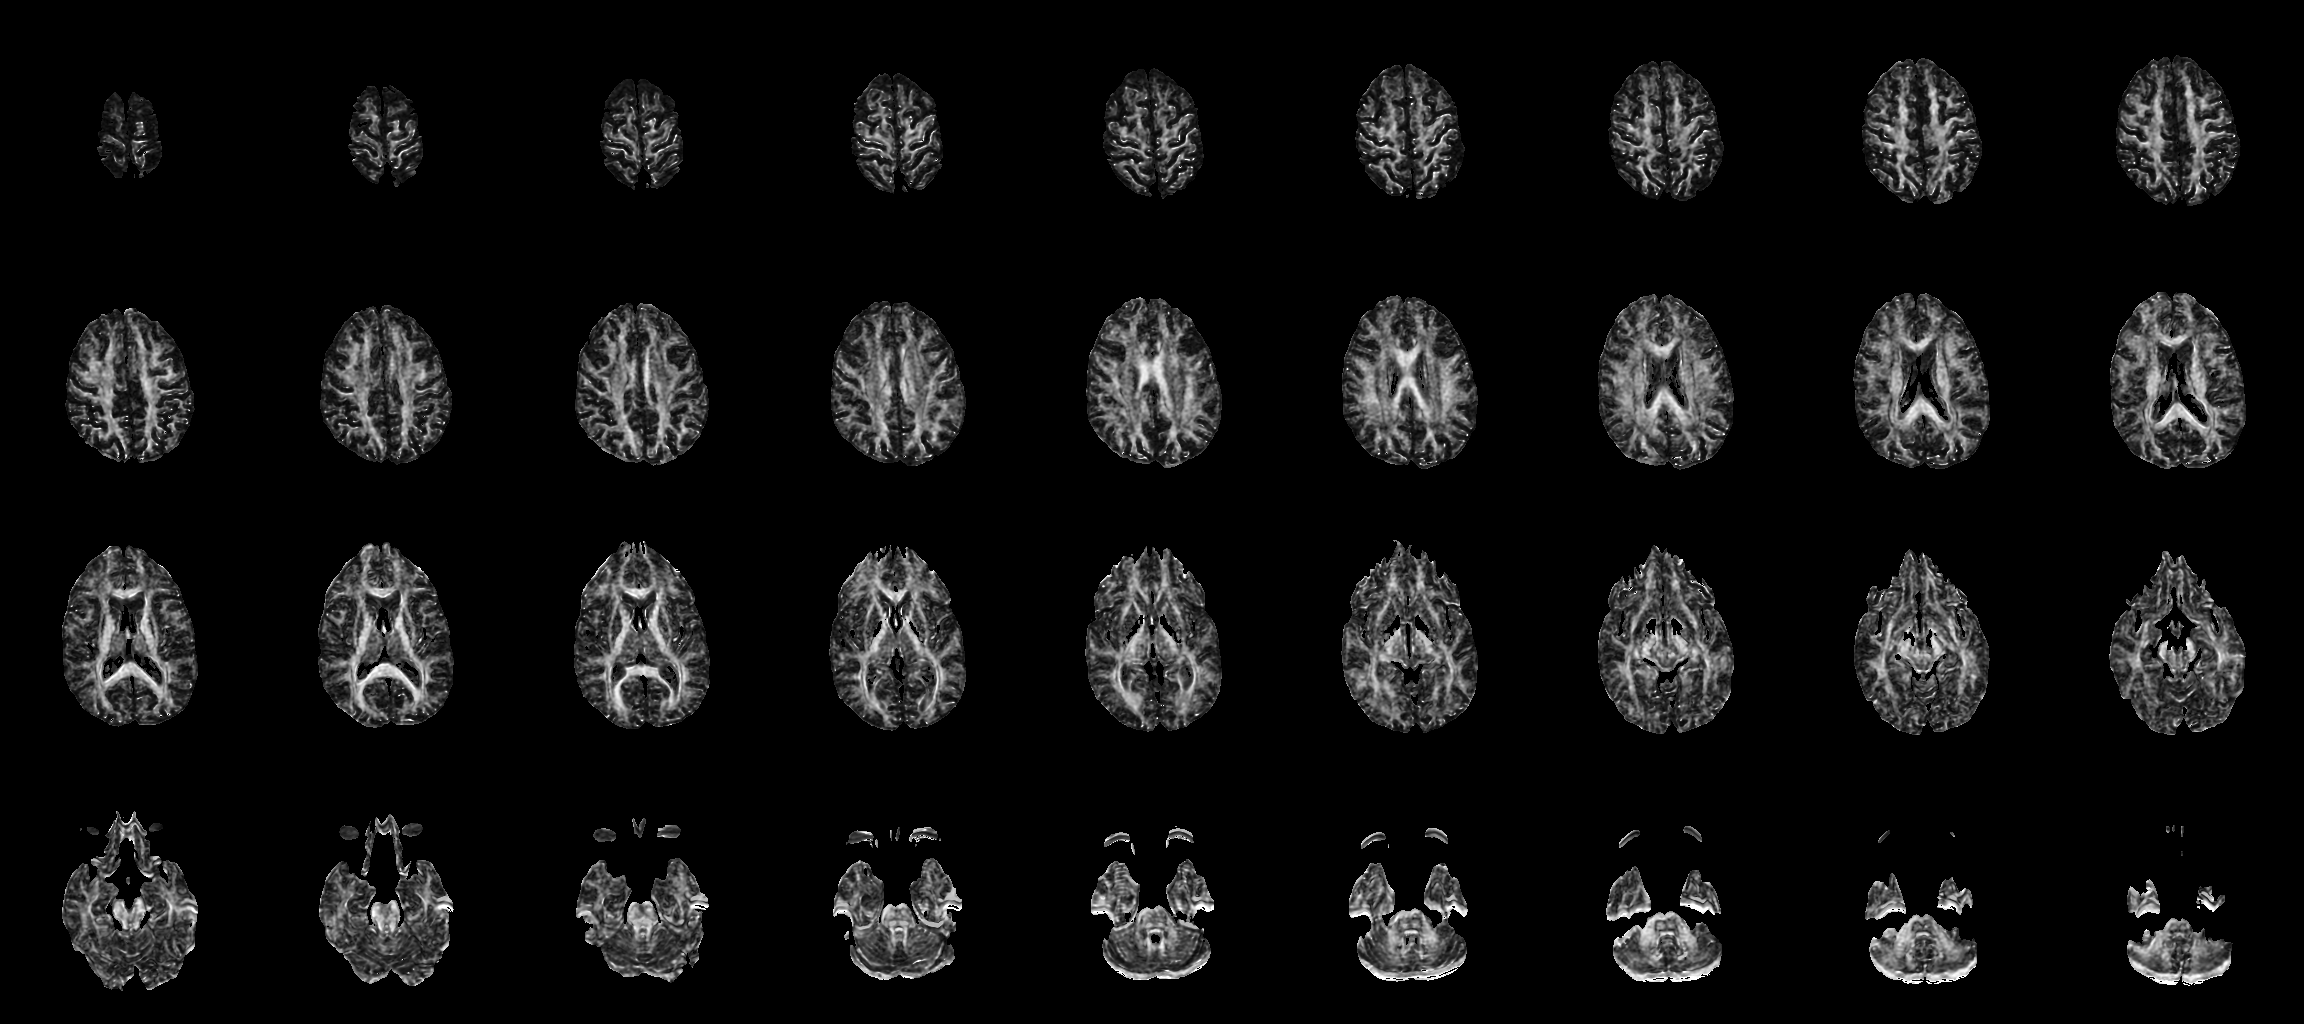
tend anvol -i 01-ten.nhdr -a fa \
 | unu tile -a 2 0 1 -s 9 4 \
 | unu quantize -b 8 -min 0 -max 1 -o 01-fa.png
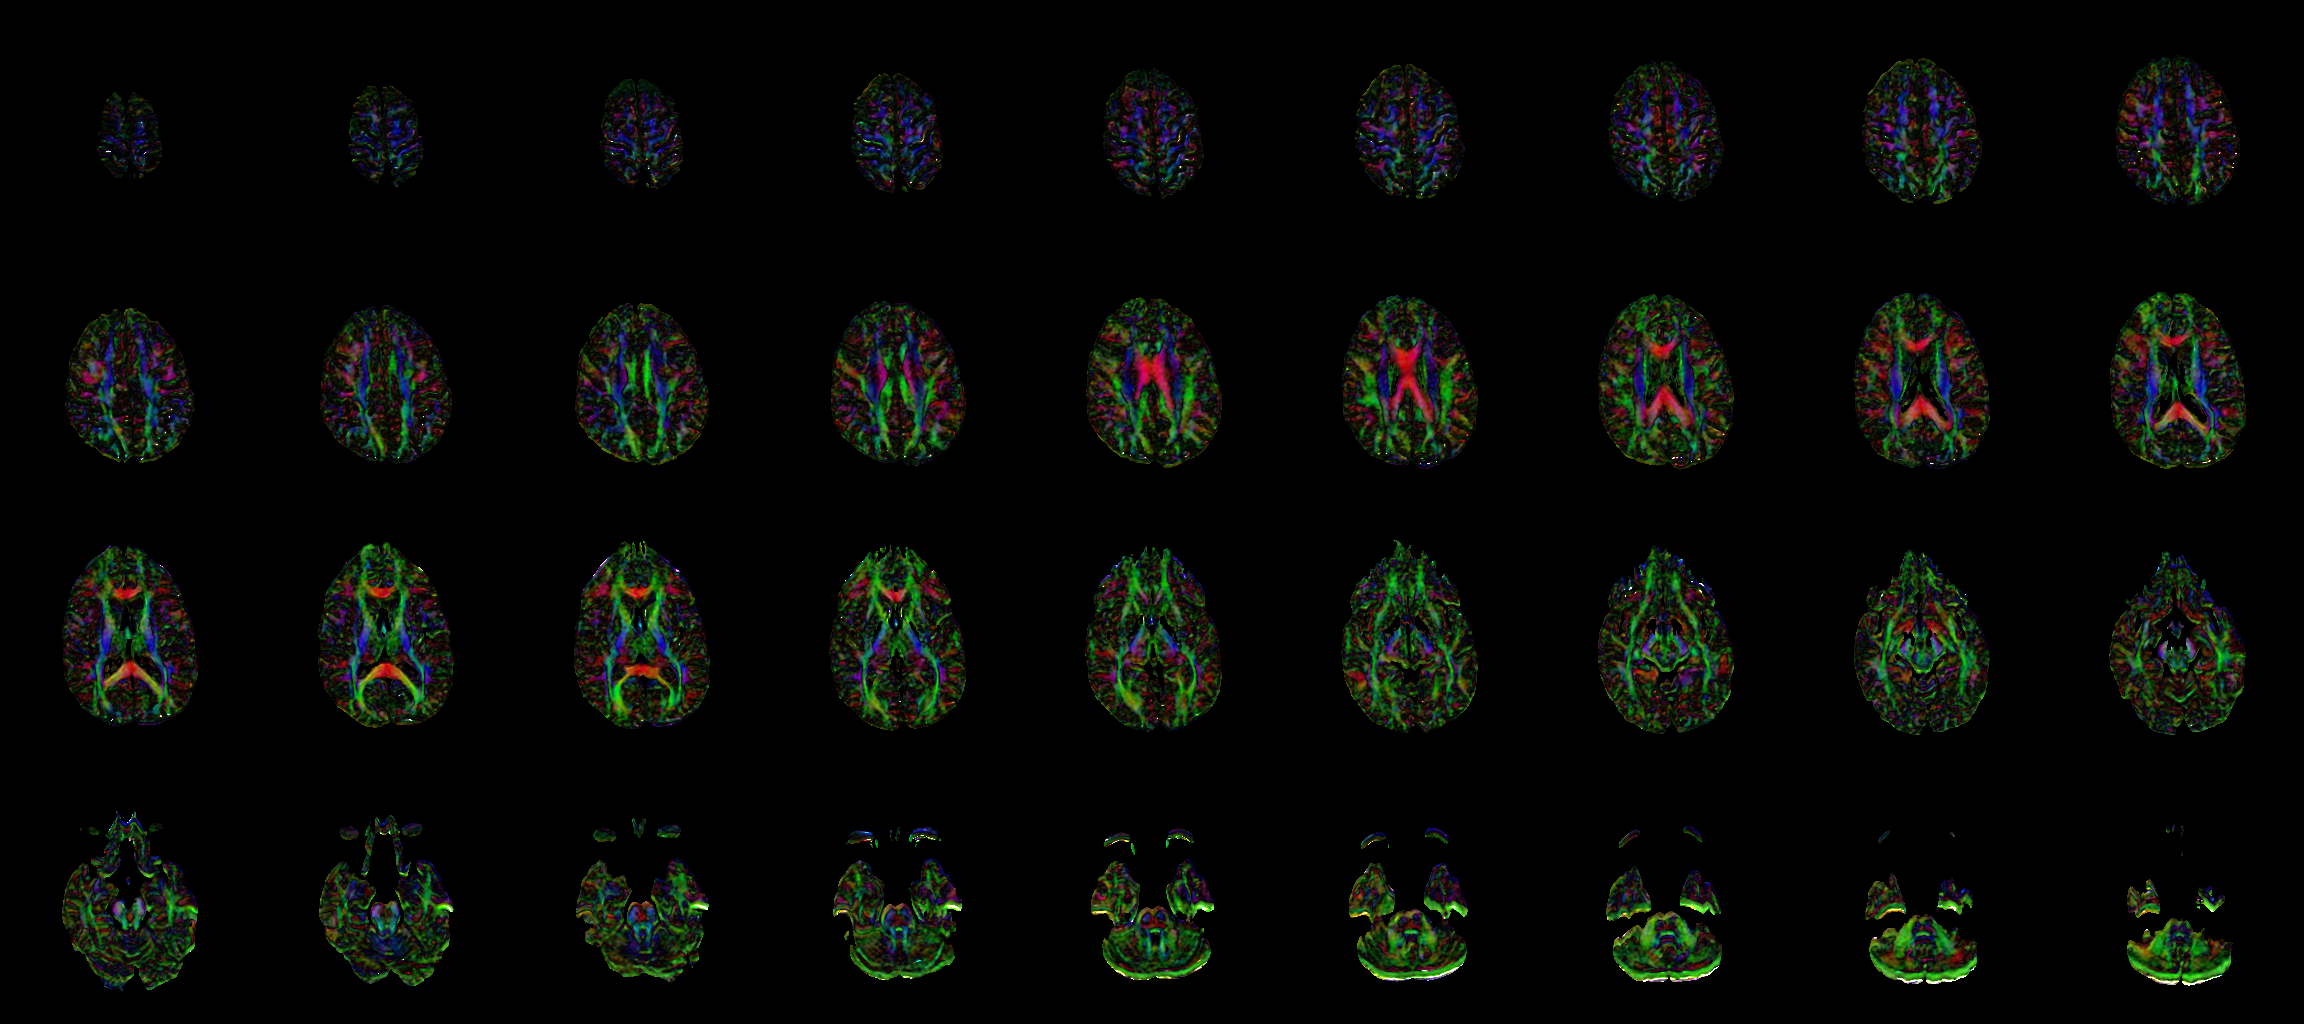
tend unmf -i 01-ten.nhdr \
 | tend evecrgb -a cl2 -c 0 \
 | unu tile -a 3 1 2 -s 9 4 \
 | unu quantize -b 8 -min 0 -max 1 -o 01-rgb.png
The first command creates a volume of FA (fractional anisotropy) measurements everywhere in the volume, then tiles it into an image. Many other anisotropy measures are supported; typing "tend anvol" shows the usage info which lists these:
tend anvol: Apply an anisotropy metric to a DT volume. The anisotropy value
will be zero in the locations which don't meet the given confidence threshold.

Usage: tend anvol -a <aniso> [-t <thresh>] [-i <nin>] [-o <nout>]

 -a <aniso> = Which anisotropy metric to plot. All the Westin metrics come in
              two versions. Currently supported:
            o "cl1", "cl2": Westin's linear
            o "cp1", "cp2": Westin's planar
            o "ca1", "ca2": Westin's linear + planar
            o "cs1", "cs2": Westin's spherical (1-ca)
            o "ct1", "ct2": GK's anisotropy type (cp/ca)
            o "ra": Basser/Pierpaoli relative anisotropy/sqrt(2)
            o "fa": Basser/Pierpaoli fractional anisotropy
            o "vf": volume fraction = 1-(Basser/Pierpaoli volume ratio)
            o "tr": trace
-t <thresh> = confidence threshold (float); default: "0.5"
   -i <nin> = input diffusion tensor volume; default: "-"
  -o <nout> = output image (floating point) (string); default: "-"
tend unmf: applying/removing the measurement frame
tend unmf -i 01-ten.nhdr -o 01-ten-nomf.nhdr
For software that does not know what a measurement frame is, you can use this to apply the measurement frame transform to all the tensor values, so that the coefficients of the tensor are expressed in the same coordinate system as the image orientation.
Note that "tend unmf" was used to make the RGB image above so that the corpus was red instead of green.
