File:Sampling spatial-parameters.png
Sampling_spatial-parameters.png (339 × 401 pixels, file size: 399 KB, MIME type: image/png)
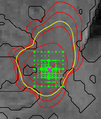
Adaptive sampling of the parameter space for the synthetic high-grade data set. Sampling points (green) for the {x; y} coordinates of the initial tumor growth location. The figure also shows isolines of tumor cell density (red), the predicted extensions of the T2 hyper-intense area (yellow) and tissue boundaries (black). The size of the green sampling points indicates how often the indicated parameter was evaluated under different combinations. The ground truth is indicated by the pink cross. Most adaptively chosen sampling points are close to the ground truth.
File history
Click on a date/time to view the file as it appeared at that time.
| Date/Time | Thumbnail | Dimensions | User | Comment | |
|---|---|---|---|---|---|
| current | 13:45, 25 March 2011 |  | 339 × 401 (399 KB) | Bmenze (talk | contribs) | Adaptive sampling of the parameter space for the synthetic high-grade data set. Sampling points (green) for the {x; y} coordinates of the initial tumor growth location. The figure also shows isolines of tumor cell density (red), the predicted extensions o |
- You cannot overwrite this file.
File usage
The following page uses this file:
