Projects:RegistrationDocumentation:Benchmarking
Registration Speed Benchmarking
we compared the performance time of the most commonly used registration methods (Expert Automated, BRAINSfit, FastAffine, Fast BSpline) and parameters (sample points, similarity metric, histogram bins, iteration limit) Both absolute time measures and relative scores are shown. Note that the absolute metric can vary greatly depending on computer architecture, operating system, amount of memory etc. Absolute metrics are therefore given only as reference. But you should be able to extract an estimate of how total computation time is likely to change when you change a particular parameter.
The test computer was a linux cluster node running a 64-bit version of Slicer 3.6
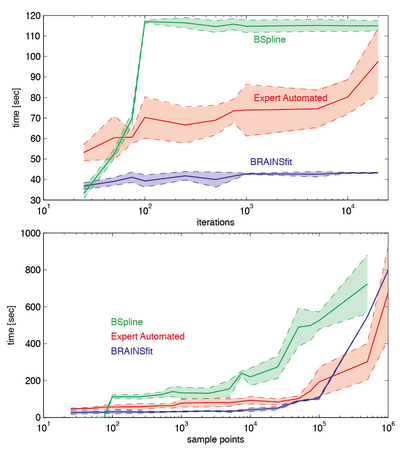
Fig.1 right: absolute computation time vs. iteration limit and sample points. The tertian limit does not increase computation time if the optimization converges to a (local) optimum, which is often the case.The number of sample points, however, has a direct effect on computation time. Time increments are modest as long as memory and CPU architecture allow some form of parallelization. Once that capacity is exhausted computation time begins to increase noticeably. For the test machine (specs see above) this happened around 10,000 pints for the BSpline method, and 100,000 points for the BRAINSfit and Expert Automated modules.
For estimates on how absolute sample points relate to average 3D image sizes, see the FAQ here.(also copy text)
Also note that the effect of sample points on registration accuracy depends critically on the DOF used. For a linear (rigid, similarity,affine) registration, all points contribute to a single global cost. For nonrigid BSpline registration, however, each point of the BSpline grid moves independently, and the quality of the cost functions depends on how many sample points fall within each grid cube element. So for guidance on choosing sample points for BSpline, consider this rule of thumb:
1. Estimate the distance between relevant corresponding features/landmarks (e.g. edges) that you wish to align. E.g. hover the mouse over each feature in the fixed and moving image and read the coordinates in mm, or use the ruler/measurement tool.
2. Estimate how much (what vole %) of the grid element contains the structure/feature of interest.
