Projects:TractLongitudinalDTI
Back to Utah 2 Algorithms
Tract-based longitudinal modeling of DTI data
This project develops a methodology to explore subject-specific, DTI data obtained from brain's white matter tracts, available at multiple but often sparsely present timepoints. The challenge is to develop a continuous spatio-temporal growth model, given discrete 4D DWI images. This would enable comparison of growth trajectories across subjects and along tracts which are biologically of interest in developmental and pathological changes.
Background
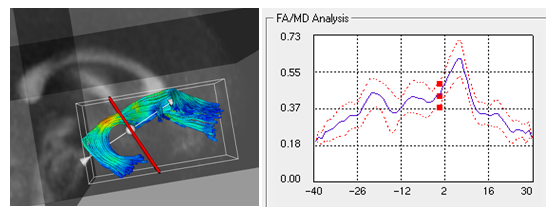
We use the arc length parametrization scheme initially proposed by Corouge et al. It represents white matter fiber tracts obtained via streamline tractography in the brain's atlas tensor image as a function of arc length. (Atlas construction uses unbiased atlas building schemes followed by back transformations to subjects' DTI images to obtain identical fiber tract geometry across subjects, populated with subject specific diffusion data). We use the mean diffusion scalar invariants derived from these individual fiber bundle cross sections, as our input longitudinal diffusion profiles.
Subject-specific spatiotemporal continuous growth model
We propose the use of Verhulst-Pearl logistic equation to capture temporal changes, while using a non-parametric kernel along arc length to account for biologically motivated functional along-tract relationship in the diffusion data.
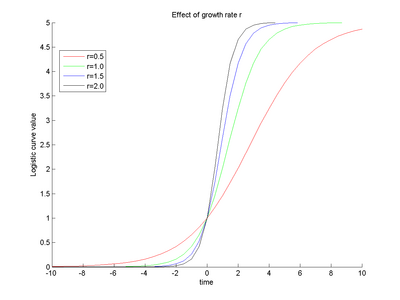
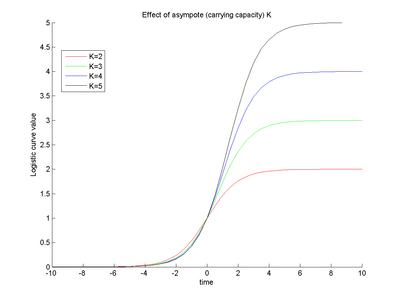
From the definition of the logistic function, the parameter r represents the growth rate of the diffusion invariant and the parameter K represents the asymptote value. The overall function shape intuitively follows the growth pattern we expect to see during brain maturation. The diffusion invariants start with an initial diffusion profile along tract, and have a non linear temporal growth trajectory showing maximum changes in early childhood and then slowing down or almost saturating at a certain age. (For instance, observed diffusion changes are much more in neonates than in an adult brain). The temporal trajectories may also differ along the tract's length giving localized changes. Since our method gives us continuous along-tract, growth trajectories all along time, we can compare subjects with respect to differences in diffusion profiles at birth, growth rates at any given age as well as the asymptote saturation values. This gives us important information to understand delayed or abnormal brain maturation by comparing a normative growth surface with an individual's or by comparing the model's parameters across subjects.
Results
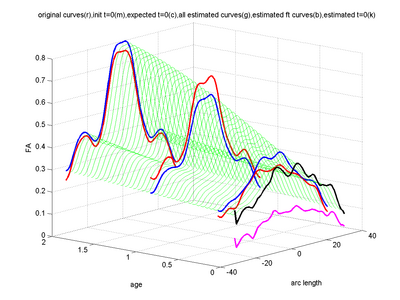
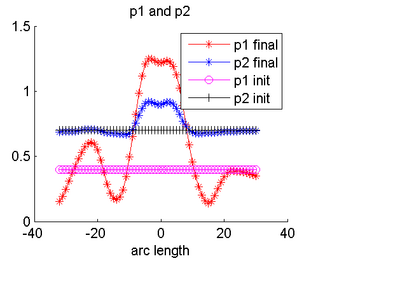
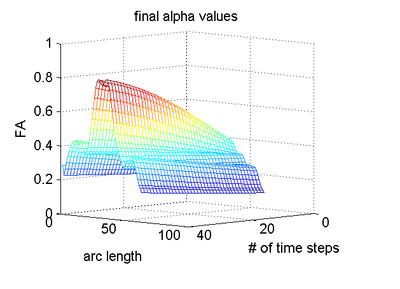
Below are some results using synthetic data. For more validation results and extension of the framework to jointly estimate individual subject trajectories together with a normative trajectory, refer to Sharma et al. (ISBI '12).
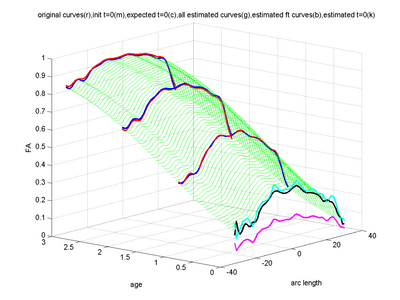
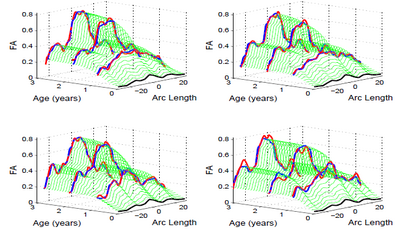
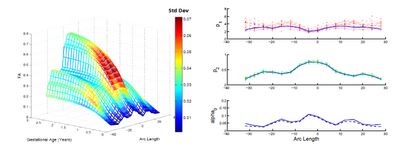
The below images show jointly estimated personalized trajectories for 15 control subjects along with the average growth trajectory. The estimated model parameters for 15 subjects as well as the average trajectory are also shown. The normative trajectory is colored by the local standard deviation. It points to the fact that despite individual variability in the maturation process, there is a strong agreement in the asymptote FA values seen around a gestational age of 2.5 years indicating a relative stabilization of the white matter changes across subjects. The framework thus quantifies patient-specific changes in serial diffusion data given discrete-time diffusion curves.
Experiments with Huntington's data
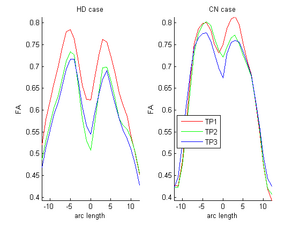
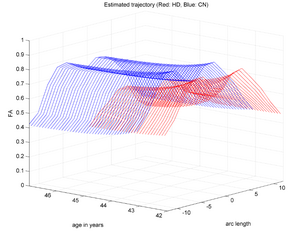
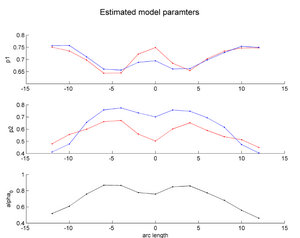
During the NAMIC Winter project week, we worked on registering subjects with Huntington's disease in the same coordinate space as control subjects. We then applied the above framework Sharma et al. ISBI'12 to quantify the differences in normal expected aging versus the accelerated white matter changes expected in HD. Details of the data pre-processing steps and image registration are available on the Winter AHM page. Some results are summarized here for FA value along the genu tract.
Two subjects- one being a HD patient (10027) with a high burden factor (higher factor value (of factor 12) implying that the subjects is closer to the onset) and the other being a control subject (10004) are chosen for concept demonstration. Both have a similar baseline scan age (42 and 43 years respectively) as well as a similar time separation between follow up scans. This allows an intuitive comparison of the estimated growth trajectories.
Experiments with Krabbe's data
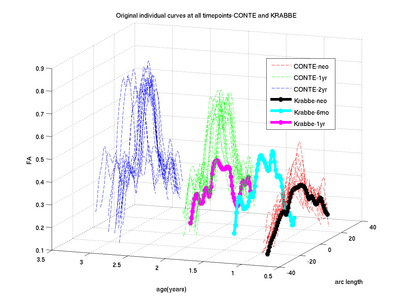
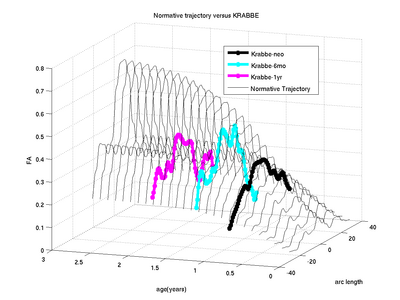
We have also applied the framework to study white matter changes in infants with Krabbe's disease. Here we show some preliminary results for the FA tract profile along the genu tract for a single subject with Krabbe's disease. In theory, FA non-linearly increases with time along genu owing to a healthy brain maturation process. However, in Krabbe's case, the FA does not follow a monotonic change pattern.
Future work
As we see in the Krabbe experiment, the model assumes a monotonic change along time. Neighboring locations along the tract can have different, yet correlated time changes. For eg. we can see localized increases or decreases along the tract length with respect to the time evolution. However, owing to the definition of the logistic function, any non-monotonic behavior along time at any given tract location is not modeled accurately. Therefore, in cases like the Krabbe's subject, we need a more relaxed and flexible semi-parametric or non-parametric model to remove the constraints coming in from the parametric nature of the current model. This is currently work under progress. To utilize the quantification of growth trajectories enabled by this method, we also require a systematic hypothesis testing scheme to draw conclusive results of individuals differing from normative patterns or populations differing in their evolution behaviors. This too is currently being worked upon.
References
- Sharma, A., Durrleman, S. , Gilmore, J.H. , Gerig, G. Longitudinal growth modeling of discrete-time functions with application to DTI tract evolution in early neurodevelopment. Proc. of 9th IEEE International Symposium on Biomedical Imaging (ISBI May'12), p.1397-1400.
- Corouge, I., Fletcher, P.T., Joshi, S., Gouttard, S., Gerig, G., 2006. Fiber tract-oriented statistics for quantitative diffusion tensor MRI analysis. Med Image Anal, pp. 786-798.
- Goodlett, C.B., Fletcher, P.T., Gilmore, J.H., Gerig, G., 2009. Group analysis of DTI fiber tract statistics with application to neurodevelopment. Neuroimage, pp. S133-142.
Key Investigators
- Utah: Anuja Sharma, Stanley Durrleman, Guido Gerig
