FE Mesh Quality Visualization
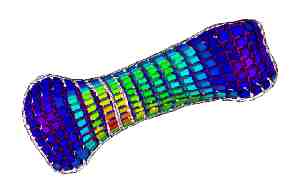
This topic of the FE project involves generating visuals using VTK that show the quality of individual elements in a Finite Element mesh. Generally, boundary elements are of lower quality than internal elements due to geometric constraints. It speeds up the mesh generation process if quick visualizations are constructed to provide element quality feedback in advance of importing the mesh into the FE simulation package.
Mesh Quality Filter
Visualizations utilize the vtkMeshQuality filter to evaluate mesh elements. We plan to extend the current mesh quality algorithms to add more tests for Hexahedral mesh element types in the future.
Rendering Techniques
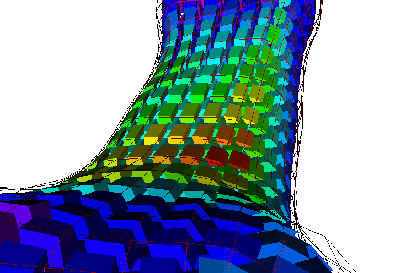
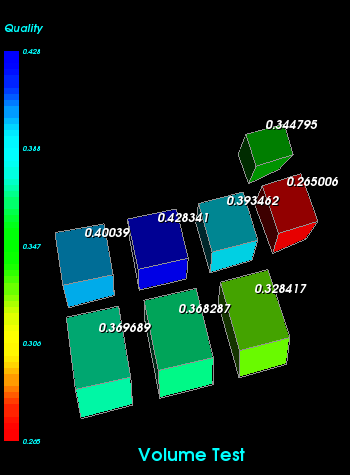
The mesh quality filter adds floating point "quality" values to each VTK cell in the mesh dataset. There is a one-to-one correspondence between mesh elements and cells in a vtkUnstructuredGrid object. Several techniques are planned for the visualization tools constructed by this project, including dynamic element sizing and thresholding elements above an adjustable quality value. In the examples shown here, each element is reduced in size, yet keeps its aspect ratio. Each element is colored according to its individual quality value.
Selecting Elements by Threshold Value
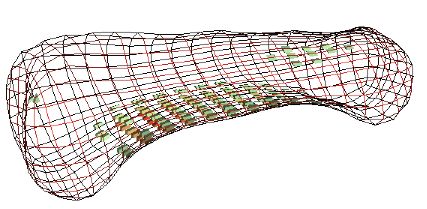
Because of the large number of elements in a mesh, it is useful to display only certain elements. We provide for this by using a threshold value to enable the display of only "interesting" elements. The per element quality value attached to each element is used to determine whether the particular element should be rendered or not. Below is a sample image where only elements of lower quality are rendered. Notice that these elements lie entirely on the mesh boundaries.
Comparing the Metrics in the VTK Mesh Quality Filter
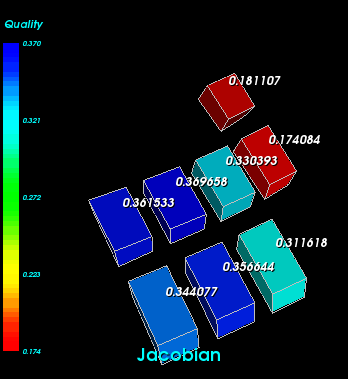
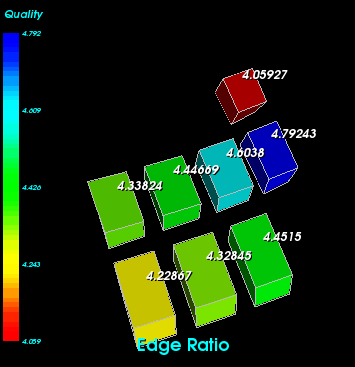
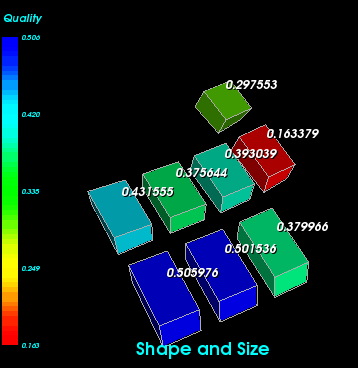
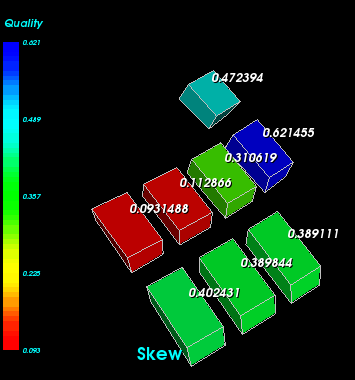
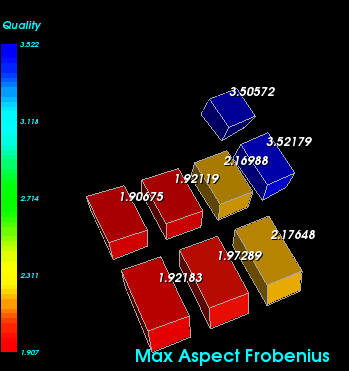
In December 2006 (VTK 5.1), the vtkMeshQualityFilter was updated to reference the Verdict external library for mesh quality computations developed by Sandia National Labs. Verdict includes a very complete list of tests to be applied to mesh element types (hexahedral, tetrahedral, quad, tris, etc.). To understand which metrics will be the most useful for our project, we selected several boundary elements from a finger bone dataset which had varying degrees of distortion and created the following visual inspection results.
