2014 Project Week:LongitudinalDTI
Key Investigators
- Utah: Anuja Sharma, Bo Wang, Guido Gerig
- UCLA: Andrei Irimia, John D. Van Horn
- UNC: Martin Styner
Project Description
Objective
- Patient specific modeling of longitudinal changes in white matter integrity along tracts, with emphasis on seemingly unaffected regions of the brain.
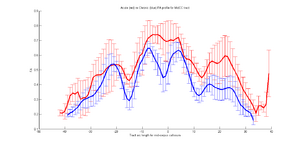
- Identify changes in fiber tract architecture along with possible WM atrophy reflected in the change in diffusion properties over time. We eventually want to model the longitudinal evolution of tract's diffusion properties, e.g. FA, by utilizing the complete statistical distribution observed along the length of the tract's 3D geometry, instead of using a simplified cross sectional average FA profile (Sharma et al, ISBI 2013).
- Specific goals for this week include DTI pre-processing to improve the quality of the tractography results that we have obtained in the past for our dataset.
Approach, Plan
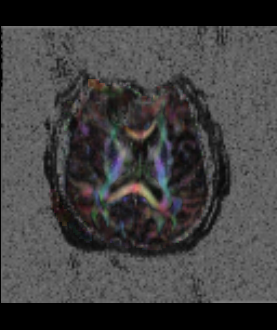
- Quality check of the TBI data using DTIPrep to correct for DTI related imaging artifacts, including checking for potential bias fields.
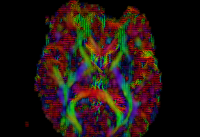
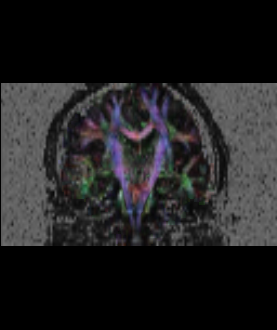
- Validation of the estimated DTI via glyph visualizations.
- Longitudinal co-registration of the patient's scans followed by tractography to verify the consistency of the extracted white matter tracts.
- Comparison of diffusion profiles along tract in a longitudinal setup to identify possible changes at the chronic timepoint.
Progress
- The proposed workflow was successfully carried out in Slicer for a single TBI patient with two longitudinal DTI scans. The detailed steps are described in the following sections.
- Utilized components of the UNC-Utah NAMIC tools for the current analysis.
- Had discussions with the UCLA TBI team on future directions, attended the TBI DBP meeting and the DTI breakout session.
Patient-specific longitudinal DTI analysis
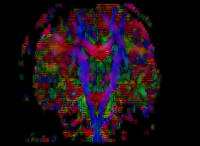
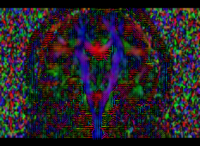
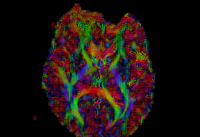
In our previous attempt at this workflow, the fibers we obtained after tractography were very noisy at both the acute and chronic timepoints. Therefore to improve our results, for the current week our preliminary focus was to improve the data quality via DTI pre-processing. We tried out various options including rician noise filtering for DWI smoothing, checking for possible bias fields, common DTI related artifacts like motion correction and eddy current artifacts. Overall, we got the best results by going through the complete DTIPrep pipeline for both the longitudinal scans. The acute scan saw considerable quality improvement after the DTI Prep QC. For the sanity check of the tensors estimated from the corrected images, we used the glyph visualizations. However since a TBI patient may exhibit several types of lesions and edema with varying levels of severity, the actual white matter pathways may be damaged and/or bent out of shape. Since the degree of white matter integrity being compromised is usually unknown, we found that the glyphs alone were hard to validate visually at both timepoints.
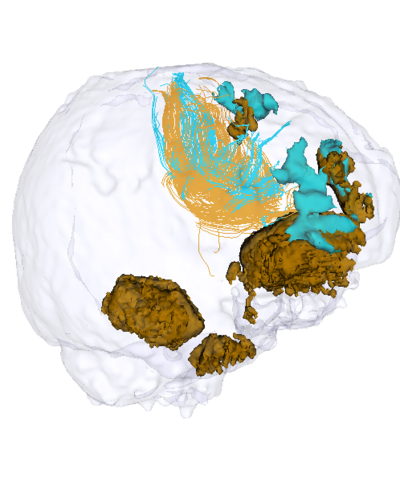
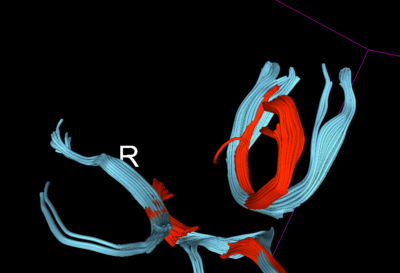
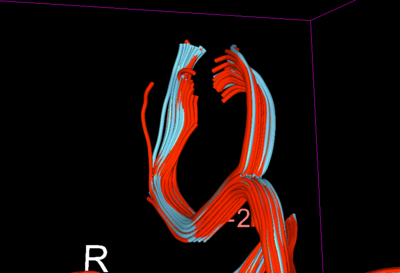
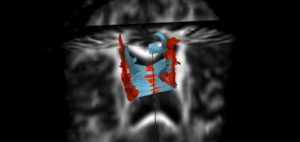
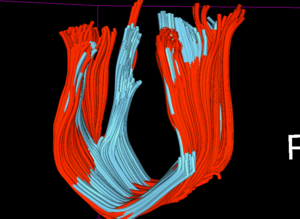
Therefore, for further validation of the improvement post-QC, we created some fiducials along the corpus callosum and used the same fiducials for tractography in DTI before and after QC. Considerable improvement (in terms of what is an expected tract geometry) was seen specially in the fibers of the QCed Acute DTI scan.
For a longitudinal evaluation, its necessary to have all the DTI scans co-registered. Using the QCed versions, we co-registered the acute and chronic timepoints using the corresponding FA images, with the chronic FA image as our moving image. We also applied masks to improve the registration accuracy. The obtained affine + spline transform was applied to the DTI image along with tensor-appropriate resampling. Following the co-registration, a common ROI was created for the middle portion of the corpus callosum tract which for the given patient, seems to be in the region not directly in the proximity of the lesions. The fibers from the chronic timepoint seems to have undergone some geometry changes as well as the associated diffusion profiles indicate a loss of white matter integrity over time.

