Home < 2014 Summer Project Week:Longitudinal patient specific DTI analysis
Key Investigators
- Utah: Anuja Sharma, Guido Gerig
- UNC: Francois Budin, Martin Styner
Project Description
Objective
- Patient specific modeling of longitudinal changes in white matter tract integrity for a neonate with basal ganglia injury caused by asphyxia (as compared with an age matched control neonate subject).
Approach, Plan
- We will be using DICOM/DWI/DTI modules available as a part of Slicer for a majority of the steps - starting from raw DICOM data up to the assessment of the fiber tract diffusion profiles.
- Multiple time points from both the subjects would be co-registered to enable a comparative analysis.
Progress
- An initial attempt at processing the complete pipeline is completed for a single subject with basal ganglia injury and a control subject.
- Slicer modules were used to create an end-to-end processing solution. Some of the steps required command line software utilities and are mentioned in detail below.
Patient-specific longitudinal DTI analysis
The data consists of four longitudinal scans for each subject: day 1, day 2, day 10 and day 30 (after birth). Here we briefly outline the sequential steps that were followed for the analysis (Verde 2014):
- DICOM to DWI conversion using Slicer's DWIConvert.
- DWI Quality control using DTI Prep. A few bad gradient directions were removed as well as artifacts like motion correction were taken care of. Most of the artifacts that caused an exclusion were Venetian blinds or random high intensity slices.
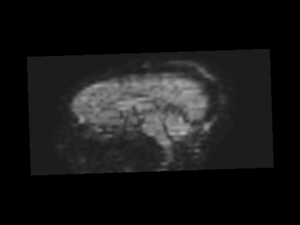 Bad gradient direction in one of the DWI images-removed using DTI Prep |
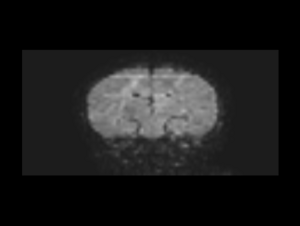 A case of high intensity slice artifact-removed using DTI Prep |
- Mask generation for DWI. The otsu mask created using Slicer module contained holes that required manual editing. It also contained the eyes which had to be manually edited out. Therefore, for this step we used the command line brain extraction tool instead.
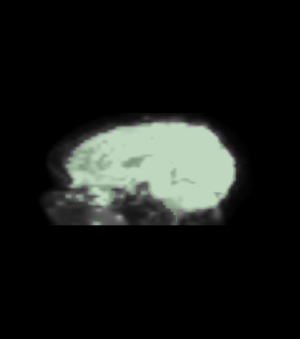 Mask generated using otsu threshold |
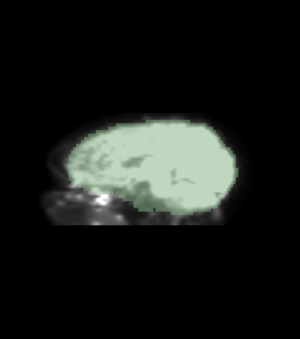 Mask from the brain extraction tool |
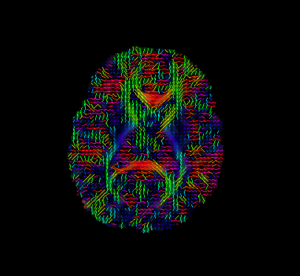
- DWI to DTI conversion was done using Slicer by utilizing the mask generated previously. We also performed a sanity check by overlaying glyphs and performing an approximate full brain tractography at this stage.
|
|
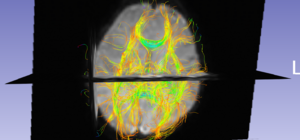 Full brain tractography for sanity check |
- Considering the non-linear speed at which early neurodevelopment occurs, we chose day 30 as our reference time point for co-registering all other timepoints. Given the time range that our data covers, relatively, the brain shows the maximum structuring possible at day-30 (within a span of one month after birth). Therefore, all other timepoints were registered to the day 30 image of the control subject. DWI baseline images were used for the registration and the transforms obtained were used to resample the corresponding DTI images. After this step, images from all the timepoints, from both the subjects, were in the same space.
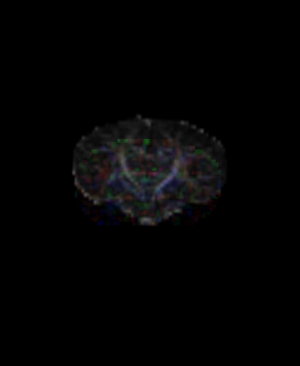 FA image of control's day-30 time point overlaid with the DTI of control's day-1 timepoint- before co-registration |
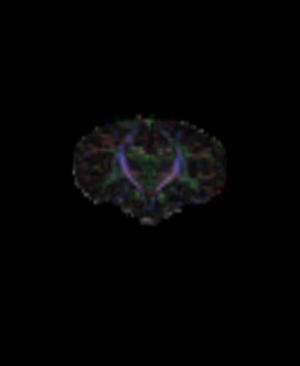 FA image of control's day-30 time point overlaid with the DTI of control's day-1 timepoint- after co-registration |
- A label map based ROI is created for the posterior internal capsule tract due to its proximity to the basal ganglia region of the brain. Since the images are co-registered, ROI is defined only once in the space of the control's day-30 image and used without change for tractography in all other timepoints for both subjects. This provides us with the fiber tract definitions from all eight DTI images.
 Posterior internal capsule white matter tract: different colors correspond to different timepoints from both subjects, control as well as basal ganglia subject. The ROI used for each of these tract definitions is the same owing to the prior co-registration of the images. |
- Longitudinal diffusion profiles from both subjects can now be compared to assess white matter abnormalities owing to the injury. An arc length parametrization scheme allows us to extract the cross-sectional scalar diffusion properties along the length of the tract (Goodlett 2009).
- Comparison of diffusion profiles along the tract's length indicate a delayed white matter development in the posterior internal-capsule tract during the first month after birth (when compared with an age matched control subject).
- Future work includes a better atlas creation scheme to avoid bias introduced by using a specific image as a reference frame. The fiber tract geometry needs to stay consistent for an accurate comparison. This can be achieved by retaining the atlas tract geometry and assembling diffusion properties from the individual images using the image-to-atlas transformations without actually warping the tract geometry for each individual case.
- As a next step, we intend to build a continuous model of the longitudinal change observed here at discrete time points. This continuous trajectory of change creates a framework allowing patient-specific monitoring as well as comparison of new incoming subjects with healthy trends at time points where original data may not be available. For this, we will model the cross-sectional distributions of diffusion properties as they change along time (instead of the 'average' diffusion profiles) (Sharma ISBI 2013, Sharma ISBI 2014). The change of distribution along time can provide a richer framework to identify areas of significant differences.
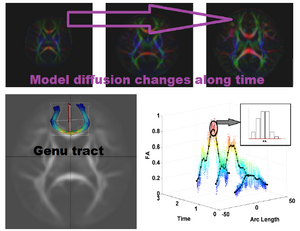 Continuous modeling of tract based longitudinal changes along time: Sharma ISBI 2013, Sharma ISBI 2014 |
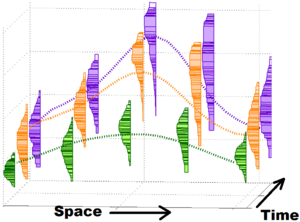 Regression of functions attributed with probability distributions along time: Sharma ISBI 2013, Sharma ISBI 2014 |
References
- A.R. Verde, F. Budin, J.-B. Berger, A. Gupta, M. Farzinfar, A. Kaiser, M. Ahn, H. Johnson, J. Matsui, H.C. Hazlett, A. Sharma, C. Goodlett, Y. Shi, S. Gouttard, C. Vachet, J. Piven, H. Zhu, G. Gerig, M. Styner. “UNC-Utah NA-MIC framework for DTI fiber tract analysis,” In Frontiers in Neuroinformatics, Vol. 7, No. 51, January, 2014.
- A. Sharma, P.T. Fletcher, J.H. Gilmore, M.L. Escolar, A. Gupta, M. Styner, G. Gerig. “Spatiotemporal Modeling of Discrete-Time Distribution-Valued Data Applied to DTI Tract Evolution in Infant Neurodevelopment,” In IEEE Proceedings of ISBI 2013.
- A. Sharma, P.T. Fletcher, J.H. Gilmore, M.L. Escolar, A. Gupta, M. Styner, G. Gerig. “Parametric Regression Scheme for Distributions: Analysis of DTI Fiber Tract Diffusion Changes in Early Brain Development,” In Proceedings of the 2014 IEEE International Symposium on Biomedical Imaging (ISBI), pp. (accepted). 2014.
- A. Sharma, S. Durrleman, J.H. Gilmore, G. Gerig. “Longitudinal Growth Modeling of Discrete-Time Functions with Application to DTI Tract Evolution in Early Neurodevelopment,” In Proceedings of IEEE ISBI 2012, pp. 1397--1400. 2012.
- C.B. Goodlett, P.T. Fletcher, G. Gerig, et al., “Group analysis of dti fiber tract statistics with application to neurodevelopment,” Neuroimage, vol. 45, no. 1, pp. S133–S142, 2009.


