RSNA 2015

| ||

|

|

|
Contents
- 1 Events
- 2 3D Interactive Visualization of DICOM images for Radiology Applications
- 3 A Practical Introduction to Structured Reporting Tools and Resources
- 4 Quantitative Image Analysis Tools: Communicating Quantitative Image Analysis Results (part of Radiomics Mini-Course: Informatics Tools and Databases)
- 5 Quantitative Imaging Reading Room
Events
Page Under Construction
| Sunday, November 29 | Monday, November 30 | Tuesday, December 1 | Wednesday, December 2 | Thursday, December 3 | Friday, December 4 |
|---|---|---|---|---|---|
| 8:00am-12:30pm: 3D Slicer Exhibit:Quantitative Imaging Reading Room. Lakeside Learning Center Hall D, Exhibit QRR002. 12:30pm-1:30pm: Meet-The-Experts Session, 3D Slicer Exhibit: Quantitative Imaging Reading Room. 1:30pm-6:00pm: 3D Slicer Exhibit: Quantitative Imaging Reading Room. |
8:00am-11:00am: 3D Slicer Exhibit: Quantitative Imaging Reading Room. Lakeside Learning Center Hall D, Exhibit QRR002. 10:30am-12:00pm: RSNA Refresher Course: "3D Interactive Visualization of DICOM Images for Radiology Applications: Hands-on Workshop." 10:30am-12:00pm: RSNA refresher course RCA22: A Practical Introduction to Structured Reporting Tools and Resources 12:15pm-1:15pm: Meet-The-Experts Session, 3D Slicer Exhibit: Quantitative Imaging Reading Room. 2:30pm-4:00pm: 3D Printing and 3D Modeling with Free and Open-Source Software (Hands-on) 1:15pm-6:00pm: 3D Slicer Exhibit: Quantitative Imaging Reading Room. |
8:00am-12:15pm: 3D Slicer Exhibit: Quantitative Imaging Reading Room. 12:15pm-1:15pm: Meet-The-Experts Session, 3D Slicer Exhibit: Quantitative Imaging Reading Room. |
---
8:00am-12:15pm: 3D Slicer Exhibit: Quantitative Imaging Reading Room. 12:15pm-1:15pm: Meet-The-Experts Session, 3D Slicer Exhibit: Quantitative Imaging Reading Room. |
8:00am-12:15pm: 3D Slicer Exhibit: Quantitative Imaging Reading Room. Lakeside Learning Center Hall D, Exhibit QRR002. 12:15pm-1:15pm: 3D Slicer Exhibit: Quantitative Imaging Reading Room. 1:15pm-6:00pm: 3D Slicer Exhibit: Quantitative Imaging Reading Room. |
8:00am-12:45pm: 3D Slicer Exhibit: Quantitative Imaging Reading Room. Lakeside Learning Center Hall D, Exhibit QRR002. 8:30am-10am: RSNA refresher course RC825B: Quantitative Image Analysis Tools |
3D Interactive Visualization of DICOM images for Radiology Applications
This course will be offered by the Neuroimage Analysis Center (NAC), at the 101th Scientific Assembly and Annual Meeting of the Radiological Society of North America (RSNA 2015). As part of the outreach missions of this NIH funded National Center, we have developed an offering of freely available, multi-platforms open source software to enable medical image analysis research. The 3D Visualization course along with the 3D Visualization-part1 and 3D Visualization-part2 datasets aim to introduce translational clinical scientists to the basics of viewing and interacting in 3D with DICOM volumes and anatomical models using the 3DSlicer software. The version of the software that will be used during this course is Slicer4.5.
- CME Content Code: Informatics
- CME Credits Categories:
- AMA PRA Category 1 Credits™: 1.5
- ARRT Category A+ Credit: 1.5
Teaching Faculty
- Sonia Pujol, Ph.D., Surgical Planning Laboratory, Department of Radiology, Brigham and Women’s Hospital, Harvard Medical School, Boston MA.
- Ron Kikinis, M.D., Surgical Planning Laboratory, Department of Radiology, Brigham and Women’s Hospital, Harvard Medical School, Boston MA.
- Kitt Shaffer, M.D. Ph.D., Boston University School of Medicine, Department of Radiology, Boston Medical Center, Boston, MA.
Logistics
- Date: Monday November 30, 10:30am-12:00 pm
- Location: Room S401AB, McCormick Conference Center, Chicago, IL.
- Registration: Please visit the RSNA registration website.
A Practical Introduction to Structured Reporting Tools and Resources
Learning objectives: 1) Understand the advantages of using structured data capture tools for research at your institution. 2) Learn how RSNA Radlex and other popular lexicons can help reduce ambiguity in your data. 3) Learn about tools leveraging the National Cancer Institute’s Annotation Imaging and Markup (AIM) format for reporting radiologist observations and quantitative image analysis results. 4) Learn about tools leveraging DICOM for reporting quantitative image analysis results.
Abstract: Institutions across the world are sitting on a potential gold mine of imaging-related information about their patients, but many are unable to make use of it. Structured reporting helps address this problem by leveraging standardized lexicons and case report forms to extract meaningful information from images and enable easy reuse of the resulting data. A number of initiatives have been developed by academic institutions, governments, and other organizations in order to help promote the broader use structured reporting in clinical imaging research. This course seeks to convey a basic understanding of structured reporting concepts and a summary of available tools and resources. Participants should leave the course with a knowledge of which tools/resources will best suit their needs and how to get started with using them.
- AMA PRA Category 1 Credits™: 1.5
- ARRT Category A+ Credit: 0
Teaching Faculty
- Justin Kirby, Bethesda, MD (Presenter)
- Pattanasak Mongkolwat, PhD Bangkok, Thailand (Presenter)
- Daniel L. Rubin, MD, MS Palo Alto, CA (Presenter)
- David A. Clunie, MBBS Bangor, PA (Presenter)
- Andriy Fedorov, PhD Boston, MA (Presenter)
Logistics
- Date: Monday November 30, 10:30am-12:00 pm
- Location: Room S401AB, McCormick Conference Center, Chicago, IL.
- Registration: Please visit the RSNA registration website.
- Course Number: RCA22
Quantitative Image Analysis Tools: Communicating Quantitative Image Analysis Results (part of Radiomics Mini-Course: Informatics Tools and Databases)
Learning objectives: 1) Review the meaning and importance of interoperability for quantitative image analysis tools. 2) Review specific use cases motivating standards-based interoperable communication of the analysis results. 3) Learn about free open source tools that can facilitate interoperable communication of analysis results using DICOM standard.
Abstract: Quantitative imaging holds tremendous but largely unrealized potential for objective characterization of disease and response to therapy. Quantitative imaging and analysis methods are actively researched by the community. Certain quantitation techniques are gradually becoming available both in the commercial products and clinical research platforms. As new quantitation tools are being introduced, tasks such as their integration into the clinical or research enterprise environment, comparison with similar existing tools and reproducible validation are becoming of critical importance. Such tasks require that the analysis tools provide the capability to communicate the analysis results using open and interoperable mechanisms. The use of open standards is also of utmost importance for building aggregate community repositories and data mining of the analysis results. The goal of this course is to build the understanding of the interoperability as applied to quantitative image analysis, with the focus on clinical research applications.
Information for the parent course Radiomics Mini-Course: Informatics Tools and Databases
- AMA PRA Category 1 Credits™: 1.5
- ARRT Category A+ Credit: 1.5
Teaching faculty
- Jayashree Kalpathy-Cramer, MS, PhD, Boston, MA
- Andriy Fedorov, PhD, Boston, MA
- Justin Kirby, Bethesda, MD
Logistics
- Date: Friday December 4, 8:30am-10:00 pm
- Location: Room S404AB, McCormick Conference Center, Chicago, IL.
- Registration: Please visit the RSNA registration website.
- Course Number: RC825
Quantitative Imaging Reading Room
3D Slicer: An open-source platform for segmentation, registration, quantitative imaging and 3D visualization of multi-modal image data
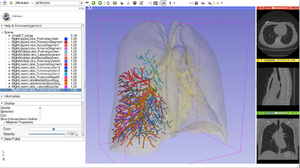
The 3DSlicer exhibit will consist in a series of thematic demonstrations using multi-modal image datasets, which include MRI, CT, PET and DCE. A team of 3DSlicer experts will be running the demonstrations with sample datasets or, where appropriate, data provided by attendees, and will deliver a series of daily 60-minute Meet-the-Experts sessions. The hands-on sessions will demonstrate 3D visualization functionalities (e.g. volume rendered head, thoracic and abdominal CT scans, surface rendered atlases of brain, knee, and abdomen), segmentation tools (e.g. semi-automated segmentation of a glioma case, MRI-based automated parcellation of the human brain), quantitative imaging features (e.g. longitudinal analysis of meningioma growth, PET/CT quantitative assessment of tumor response, traumatic brain injury cases follow-up) as well as image-guided therapy applications (e.g. exploration of peritumoral white matter for neurosurgical planning, registration of prostate imaging data). In addition, the exhibit will present new workflows for full brain tractography and multi-volume exploration of prostate DCE MRI data.
Teaching Faculty
- Sonia Pujol, Ph.D., Surgical Planning Laboratory, Harvard Medical School, Department of Radiology, Brigham and Women’s Hospital, Boston MA.
- Ron Kikinis, M.D., Surgical Planning Laboratory, Harvard Medical School, Department of Radiology, Brigham and Women’s Hospital, Boston MA.
- Steve Pieper, Ph.D., Isomics Inc.
- Andrey Fedorov, Ph.D., Surgical Planning Laboratory, Harvard Medical School, Department of Radiology, Brigham and Women’s Hospital, Boston MA.
Logistics
- Date: Sunday November 29 -Friday December 4; 8:00am-5:00pm
- Location: Exhibit LL-QRR004, Lakeside Learning Center, McCormick Conference Center, Chicago, IL.
Meet the Experts Sessions
Daily one-hour Meet-The-Experts sessions will be held from Sunday to Thursday as part of the Quantitative Imaging Room exhibit. The sessions will give participants an opportunity to interact with the on-site faculty through software demonstrations and general question and answer sessions, which will include a series of hands-on demonstrations of the 3DSlicer modules for quantitative imaging.
- Schedule:
- Sunday, November 29: 12:30 p.m. – 1:30 p.m.
- Monday, November 30: 12:15 p.m. – 1:15 p.m.
- Wednesday, December 1: 12:15 p.m. – 1:15 p.m.
- Thursday, December 2: 12:15 p.m. – 1:15 p.m.
Interoperable communication of quantitative image analysis results using DICOM standard
In this exhibit we will focus on demonstration of support for communication of image segmentation results. Image segmentation is a common task in quantitative image analysis concerned with partitioning image into regions based on certain application-specific characteristic. DICOM standard defines Segmentation Information Object Definition (IOD) (DICOM SEG) as the image object representing a classification of pixels in one or more referenced images. DICOM SEG is a versatile object that maintains detailed provenance record about the imaged subject and reference imaging data, and provides unambiguous specification of the anatomy being segmented using structured terminology. DICOM SEG also facilitates communication of the information about the segmentation method and software used, as well as information about reader for segmentations performed manually. Support of DICOM SEG has now been implemented in several research and commercial tools, including tools that are free open source, represented by the groups participating in this exhibit. DICOM SEG has also been adopted as the format for communicating algorithm comparison challenges conducted by the NCI Quantitative Imaging Network (QIN), producing a growing publicly available collection of the representative analysis results segmenting publicly available cancer-related image datasets.
Teaching faculty
- Andriy Fedorov, PhD Boston, MA
- Daniel L. Rubin, MD, MS Palo Alto, CA
- Jayashree Kalpathy-Cramer, MS, PhD Charlestown, MA
- Justin Kirby, Bethesda, MD
- David A. Clunie, MBBS Bangor, PA
- Michael Onken Oldenburg, Germany
- David Flade, DIPLENG Feldkirchen, Germany
- Rajesh Venkataraman, PhD Grass Valley, CA
- Jan Bertling Stockholm, Sweden
- Pattanasak Mongkolwat, PhD Bangkok, Thailand
- Steve D. Pieper, PhD Cambridge, MA
- Ron Kikinis, MD Boston, MA
Logistics
- Date: Sunday November 29 -Friday December 4; 8:00am-5:00pm
- Location: Exhibit LL-QRR005, Lakeside Learning Center, McCormick Conference Center, Chicago, IL.
Meet the Experts Sessions
Daily one-hour Meet-The-Experts sessions will be held from Tuesday to Thursday as part of the Quantitative Imaging Room exhibit. The sessions will give participants an opportunity to interact with the on-site faculty through software demonstrations and general question and answer sessions
- Schedule
- Tuesday 12:15pm - 1:15pm
- Wednesday 12:15pm - 1:15pm
- Thursday 12:15pm - 1:15pm
