ImageArchive/2009
From NAMIC Wiki
Home < ImageArchive < 2009


Image Archive 2009
December

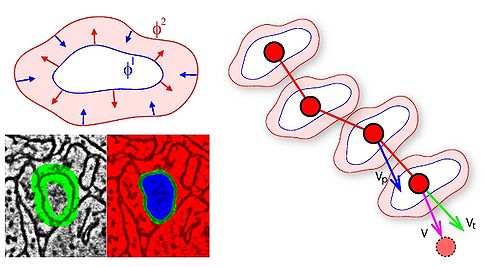
Scalable and interactive segmentation and visualization of neural processes in EM datasets. Neural process segmentation. Top left: Active ribbon model for 2D neural membrane segmentation. Left bottom: User initialization and solution with inside/outside level set. Right: 3D centerline tracking. Read more...
November

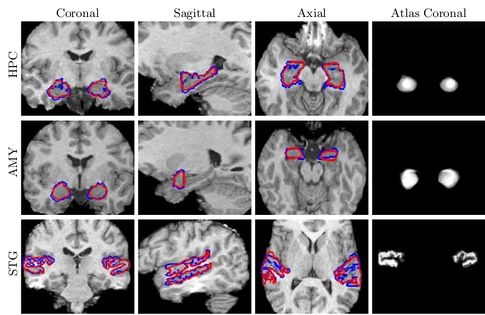
Joint Segmentation of Image Ensembles via Latent Atlases Three cross-sections of 3D segmentations of Hippocampus, Amygdala and Superior Temporal Gyrus in the left and right hemispheres. Automatic segmentation is shown in red. Manual segmentation is shown in blue. Fourth column: Coronal views of the resulting atlases for each pair of structures. Read more...
September

Cortical Correspondence with Probabilistic Fiber Connectivity. Brain deflation progress for one subject. The surface outline is shown in con- trasting colors overlayed on an axial slice of the brain. The leftmost image shows the original WM surface, and the consequent images show the progress of the deflation at 1000 iteration intervals. The second rightmost surface is used for retrieving proba- bilistic connectivity images after a final scaling step, shown on the far right. Note the progressive smoothing of the gyri as the surrounding regions become flat, which relaxes the velocity constraint on these vertices. Read more...
August

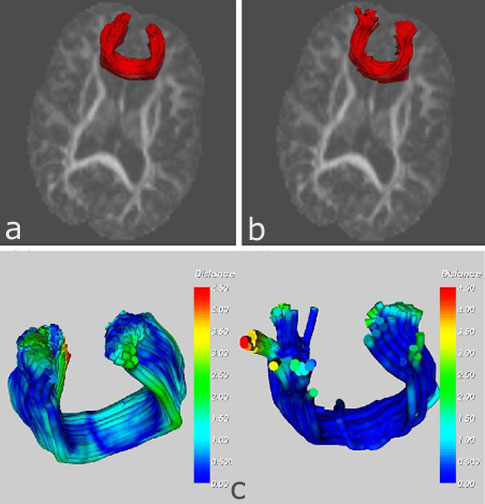
Group analysis of DTI fiber tract statistics with application to neurodevelopment. The genu tract (a) mapped from atlas is compared with (b) the tract produced by tractography in the individual. Comparison of pointwise distances between the two fiber tracts reveals a maximum difference of 4.5 mm between the two tracts. The average distance in the main body of the tract is less than 1.5 mm. Read more...
May

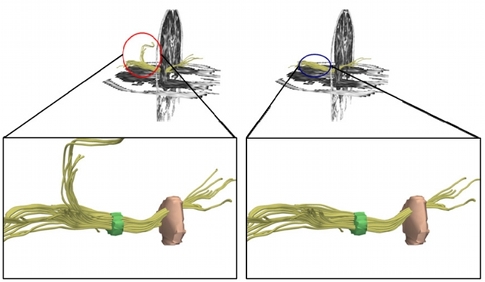
Diffusion tractography of the fornix in schizophrenia. Figure demonstrating application of “sensitivity” tool to extract fibers of interest. Tool was able to exclude anatomically incorrect fibers (left panel before, right after tool application). Read more...