Project Week 25/Interactive Manipulation of Plots and Graphs
From NAMIC Wiki
Home < Project Week 25 < Interactive Manipulation of Plots and Graphs
Back to Projects List
Key Investigators
- Davide Punzo (Kapteyn Astronomical Institute, University of Groningen, The Netherlands)
- Steve Pieper (Isomics Inc., USA)
- Jean-Christophe Fillion-Robin (Kitware Inc., USA)
- Andras Lasso (Queen's University, Canada)
Project Description
| Objective | Approach and Plan | Progress and Next Steps |
|---|---|---|
|
Implementing the following plotting and graphs infrastructure enhancement:
|
|
https://www.youtube.com/watch?v=5Ag0PzYw0Hk&index=4&list=PLctSHxZgiJy6TZCu56v4qqb_uIdUL_KEz |
Illustrations
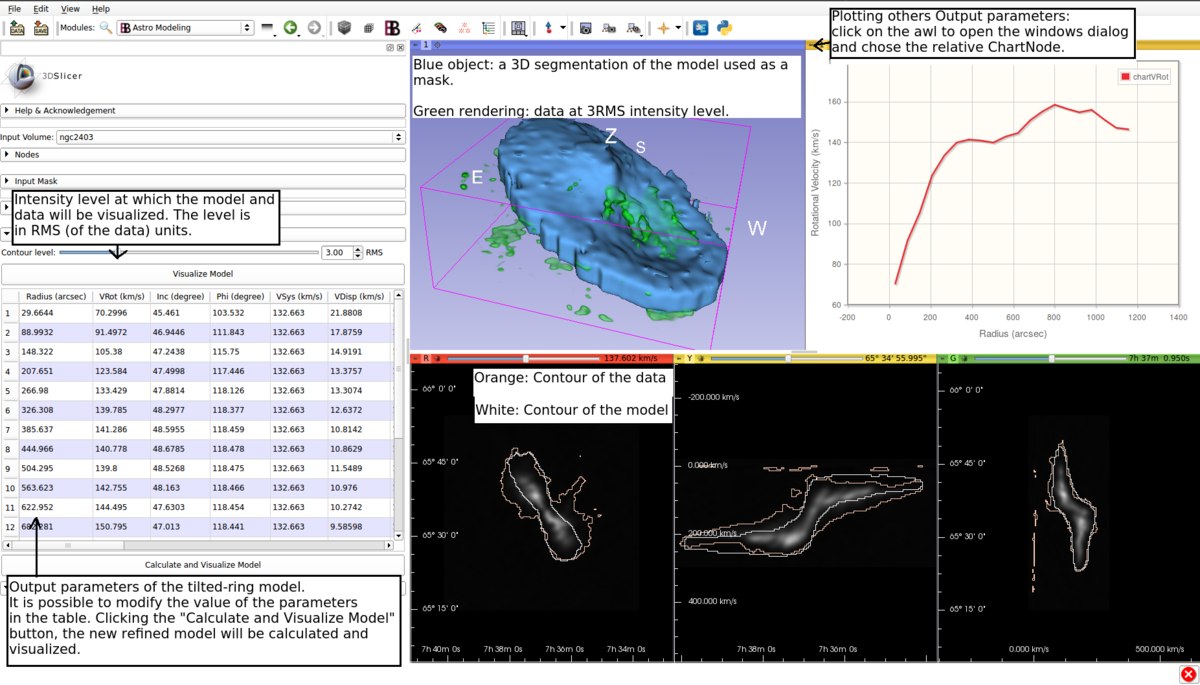
The idea is to be able to modify the parameters (in the table) of a model (blue object in the 3D View) directly from the plotting window.
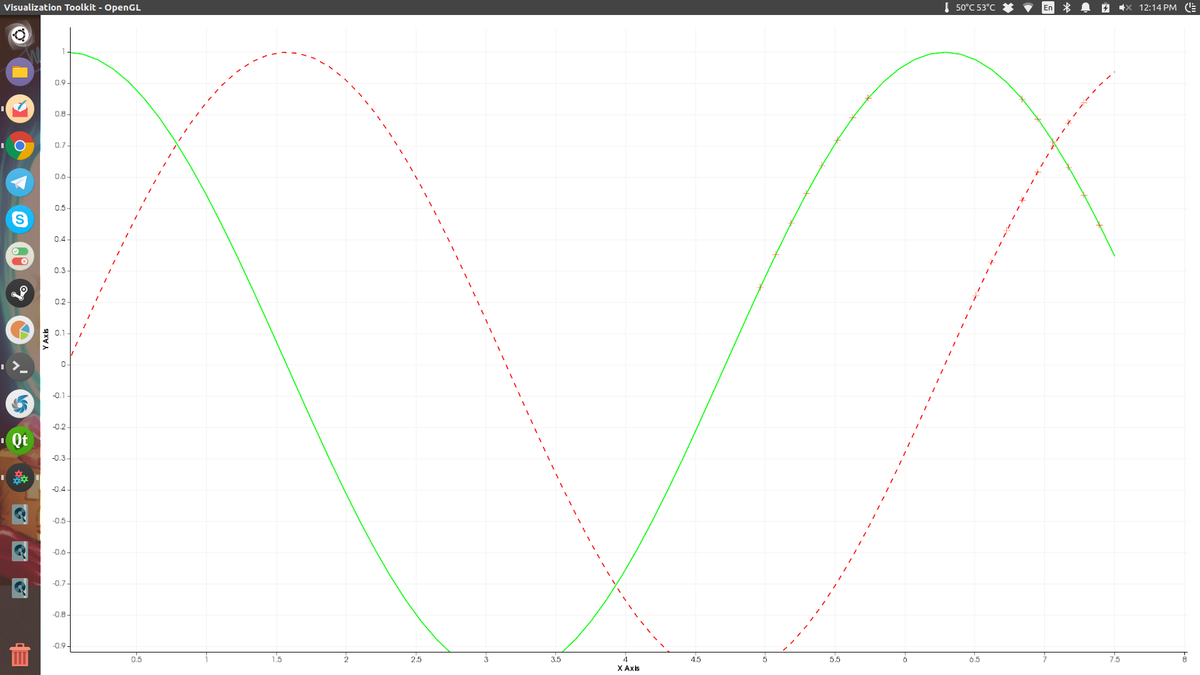
VTKPLOTS sin and cos plus data selection (red crosses) example:
Background and References
- https://www.slicer.org/wiki/Developer_Meetings/20170425
- http://www.jqplot.com/examples/customHighlighterCursorTrendline.php
- http://www.jqplot.com/examples/zooming.php
- SlicerAstro
- (Just for fun: how the gas in a galaxy looks like in 3D https://www.youtube.com/watch?v=yLjW9nbdO8g )


