Difference between revisions of "2009 Summer Project Week fusion of MRI with voltage mapping"
(Created page with '__NOTOC__ <gallery> Image:PW2009-v3.png|Projects List Image:genuFAp.jpg| </gallery> ==Key Investigators== * Dana C. Peters PhD, and Jason...') |
|||
| (5 intermediate revisions by the same user not shown) | |||
| Line 2: | Line 2: | ||
<gallery> | <gallery> | ||
Image:PW2009-v3.png|[[2009_Summer_Project_Week#Projects|Projects List]] | Image:PW2009-v3.png|[[2009_Summer_Project_Week#Projects|Projects List]] | ||
| − | Image: | + | Image:Lascar.jpg| left atrial scar by EP mapping and MRI |
| − | + | Image:scar_cartovoltage.jpg| left atrial scar by EP mapping and MRI--fused!! | |
</gallery> | </gallery> | ||
| Line 28: | Line 28: | ||
<h3>Approach, Plan</h3> | <h3>Approach, Plan</h3> | ||
| − | + | Display surfaces using VTK/ITK tool already developed, with color coding to indicate voltage, with registered scar data. Extract registered voltage data to display on MR images.<foo>. | |
| − | |||
</div> | </div> | ||
| Line 37: | Line 36: | ||
<h3>Progress</h3> | <h3>Progress</h3> | ||
| − | + | We were able to combine the voltage data from EP fused with MR. However our approach needs work. We would like to show the voltages on the MR slices, not the rendering. We would like to show the voltages maybe displayed as points not a shell--the shells are never perfect! | |
| − | |||
| − | |||
| − | |||
| − | |||
<div style="width: 97%; float: left;"> | <div style="width: 97%; float: left;"> | ||
| Line 48: | Line 43: | ||
*Taclas J, Wylie J, Nezafat R, Josephson M, Manning WJ, Peters DC. Correlation of Left Atrial Scar due to Pulmonary Vein Ablation with Recorded Ablation Sites. In:Journal of Cardiovascular MR. Los Angeles, CA, 2008. | *Taclas J, Wylie J, Nezafat R, Josephson M, Manning WJ, Peters DC. Correlation of Left Atrial Scar due to Pulmonary Vein Ablation with Recorded Ablation Sites. In:Journal of Cardiovascular MR. Los Angeles, CA, 2008. | ||
* Peters DC, Wylie JV, Hauser TH, et al. Detection of pulmonary vein and left atrial scar after catheter ablation with three-dimensional navigator-gated delayed enhancement MR imaging: initial experience. Radiology 2007; 243:690-695. | * Peters DC, Wylie JV, Hauser TH, et al. Detection of pulmonary vein and left atrial scar after catheter ablation with three-dimensional navigator-gated delayed enhancement MR imaging: initial experience. Radiology 2007; 243:690-695. | ||
| − | |||
| − | |||
Latest revision as of 13:55, 26 June 2009
Home < 2009 Summer Project Week fusion of MRI with voltage mapping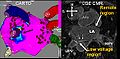
left atrial scar by EP mapping and MRI
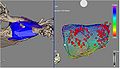
left atrial scar by EP mapping and MRI--fused!!


Key Investigators
- Dana C. Peters PhD, and Jason Taclas, MS, Beth Israel Deaconess Medical Center
Objective
Scar in the left atrium can be visualized using the cardiac MR late gadolinium enhancement technique. It can also be detected as low electrical voltages by invasive electrophysiology (EP) mapping systems, e.g CARTO maps. We wish to correlate the EP maps with cardiac MR images, by registering the two representations of scar, and displaying the voltage as a 3D color map. Figure 1 compares a CARTO map of the left atrium to an image of the left atrium, demonstrating the relationship between low voltage by EP, and enhancement by Cardiac MR.
Approach, Plan
Display surfaces using VTK/ITK tool already developed, with color coding to indicate voltage, with registered scar data. Extract registered voltage data to display on MR images.<foo>.
Progress
We were able to combine the voltage data from EP fused with MR. However our approach needs work. We would like to show the voltages on the MR slices, not the rendering. We would like to show the voltages maybe displayed as points not a shell--the shells are never perfect!
References
- Taclas J, Wylie J, Nezafat R, Josephson M, Manning WJ, Peters DC. Correlation of Left Atrial Scar due to Pulmonary Vein Ablation with Recorded Ablation Sites. In:Journal of Cardiovascular MR. Los Angeles, CA, 2008.
- Peters DC, Wylie JV, Hauser TH, et al. Detection of pulmonary vein and left atrial scar after catheter ablation with three-dimensional navigator-gated delayed enhancement MR imaging: initial experience. Radiology 2007; 243:690-695.