Difference between revisions of "2012 Winter Project Week: DTI Change Modeling"
| Line 80: | Line 80: | ||
{| border="0" style="background:transparent;" | {| border="0" style="background:transparent;" | ||
| − | |[[Image:ORIG_hd_cn.png|thumb| | + | |[[Image:ORIG_hd_cn.png|thumb|300px|center|]] |
| − | |[[Image: | + | |[[Image:Energy.png|thumb|300px|center|]] |
| + | |[[Image:Params.png|thumb|300px|center|]] | ||
|- | |- | ||
|} | |} | ||
Revision as of 11:07, 13 January 2012
Home < 2012 Winter Project Week: DTI Change ModelingKey Partners
- Utah: Anuja Sharma, Guido Gerig
- Iowa: Hans Johnson (HD Project)
Objective
We have developed a new framework for spatiotemporal analysis of parameterized functions attributed by properties of 4D longitudinal image data. Our objective is to apply the framework to model patient-specific changes along white matter tracts using serial DTI data from subjects with Huntington's disease. As an extension, multiple subjects could be modeled and compared for assessment of normative trends.
Approach, Plan
- Co-register all available intra-subject, serial DTI volumes to create a consistent atlas tract geometry (and inter-subject if multiple subjects are to be compared eventually).
- Perform atlas-based tractography followed by back-mapping to assemble scalar diffusion parameters as functions of arc length along tracts of interest.
- Apply our methodology to quantify longitudinal DTI changes along tracts using these arc length parameterized diffusion functions.
Progress
To be added
White matter analysis for PREDICT-HD DBP
Registration and Tractography
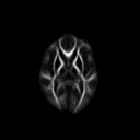
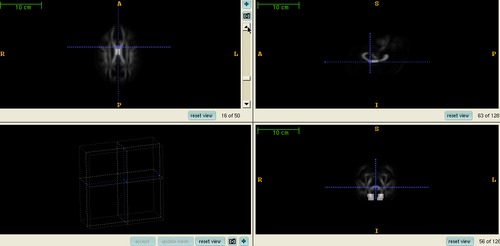
Tensor derived FA Atlas Slices from the mean atlas FA image computed by registering a couple of HD cases and Controls.
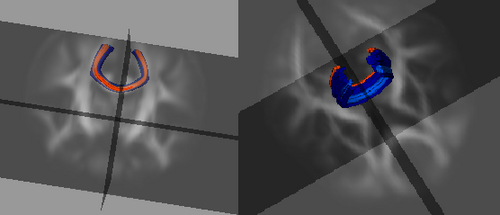
Tractography in atlas space for mid-corpus callosum tract Shown here are the source and target ROI placements along with the resulting fiber bundle representing the middle section of the corpus callosum white matter tract. This tract geometry is then mapped back to individual subjects to assemble subject specific diffusion information along the tract's length. The consistent across-subject tract definition provides a reference frame for comparison.
Longitudinal continuous spatiotemporal modeling of diffusion profiles for HD cases and Controls
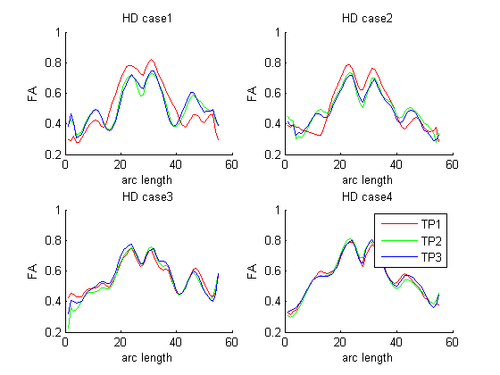
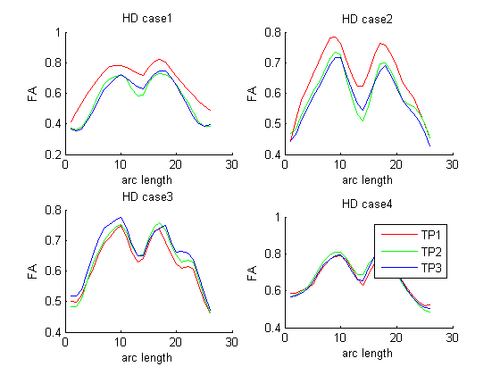
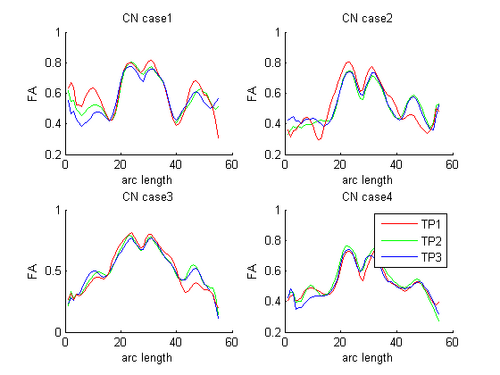
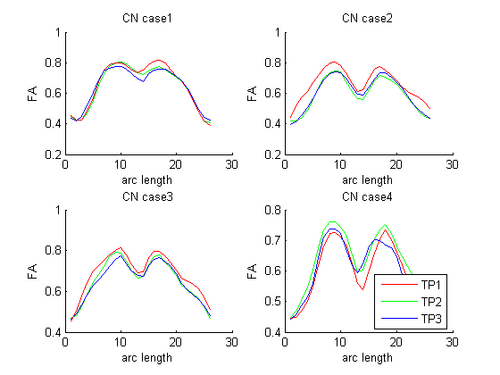
HD and Control subjects Shown below are the assembled along-tract diffusion profiles for a number of HD and Control subjects parametrized by arc length of the tract. The scalar diffusion measures (FA shown here) have been averaged across perpendicular cross sections along the tract's length.
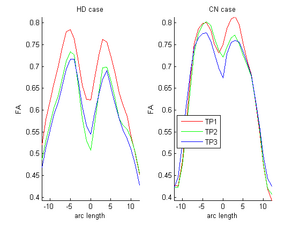
We demonstrate the feasibility of the method by applying the framework to 2 subjects- one being a HD patient (10027) with a high burden factor (higher factor value (of factor 12) implying that the subjects is closer to the onset) and the other being a control subject (10004). Both have a similar baseline scan age (42 and 43 years respectively) as well as a similar time separation between follow up scans. This allows an intuitive comparison of the estimated growth trajectories.
References
- Casey B. Goodlett, P. Thomas Fletcher, John H. Gilmore, Guido Gerig. Group Analysis of DTI Fiber Tract Statistics with Application to Neurodevelopment. NeuroImage 45 (1) Supp. 1, 2009. p. S133-S142
- Details of the framework

